🔥 Today Only: Save 30% on Premium — Offer Ends Soon! - Upgrade Now!
Map

Band 7+: "The maps show changes in a city in 1950 and now. You should write at least 150 words."

Image for topic:
Our system will evaluate the answer based on this AI-generated description.
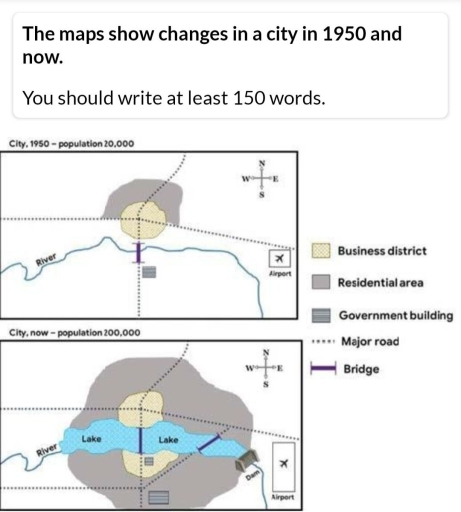
The image presents two maps showing a city in 1950 with a population of 20,000 and its current status with a population of 200,000. In 1950, the business district is marked as a small central area with a surrounding residential region and a nearby government building positioned south-east of the business district. The airport lies north-west in observable proximity, connected by a major road and a single river flows from west to east with one bridge intersecting the road. Presently, the business district spans a larger central region within an extended residential area. The government building maintains its location relative to the business district but is now surrounded by development and two lakes replacing part of the residential region. The river continues its course from west to east around the expanded residential area, including an additional bridge. The airport persists in its previous location, maintaining access through existing infrastructure.
Given the complexity of the image, the above description may not be entirely accurate.
Note: Both the topic and the answer were created by one of our users.

The two pictures show the differences in city planning between the year 1950 and the present day.

Overall, it is clear that the city has experienced significant changes in its layout, especially in the central area. Key developments include the construction of an artificial lake, expansion of residential and business zones, and improvements to transport system.

In detail, all major elements of the city, including residential, business, transport, and water systems, were either expanded, reduced in size, or removed entirely. A large artificial lake was constructed in the center of the city, along with a dam system at one end to hold the water. Around the lake, business and residential areas were noticeably expanded.

Additionally, the government building in the new city center was reduced in size. A new road was built to connect the southern and northern parts of the city, including a bridge crossing the lake. In the eastern suburbs, the old airport was replaced with a larger and more modern facility. Finally, a new administrative building for local authorities was constructed in the southern part of the city.

Word Count: 181

Answers On The Same Topic:

“The maps show changes in a city in 1950 and now. You should write at least 150 words.”

The alterations made in a town have been depicted by the comparison of maps in 1950 and in the present. Overall, it is noticeable that there have been considerable developments made in city, by the construction of dam and lake. Moreover, the population is seen to be expanded over the years. According to the details, […]

“The maps show changes in a city in 1950 and now. You should write at least 150 words.”

The given maps illustrate the modifications that were made from 1950 until now. At first glance, it is clearly seen that the town has experienced significant changes in all areas. The major development is the small river has been converted to lake. In addition, residential area which was located at north centre of the city […]

“The maps show changes in a city in 1950 and now. You should write at least 150 words.”

The given maps illustrate how a city has change between 1950 and the present day. Overall, it can be clearly seen that both the business district and the residential area have expanded considerably. In addition, the river has been replaced by two lakes, and new infrastructure such as major roads and a larger bridge has […]

“The maps show changes in a city in 1950 and now. You should write at least 150 words.”

The maps below shows a plan of a city in 1950 and at the present. At the first glance, it is clear that population increased. Also, all areas became larger, a big lake appeared and the number of main roads increased. On the one hand, looking at a map of the city from 1950 and […]

“The maps show changes in a city in 1950 and now. You should write at least 150 words.”

The maps present the information about the major changes in a city that occured from 1950 and modern appereance. Overall, the population of city boosted in 10 times from 20,000 to 200,000 over the decades and city’s infrastructure became more advanced in both northern and southern coasts. In 1950, the northern part of the city […]

See All

Other Topics:

The maps below illustrate how Fenris changed from 1990 to 2012.

The diagram provides information about changes of Ferni’s city. The maps compare 1990 city’s layout with the new one of 2012. Overall,it is clear that there were not any big changes and the disposition of various city’s parts is almost the same as before. Moreover, looking from another perspective, right layout side has changed more […]

The two maps below show a housing estate now,and how it will look after redevelopment

The two maps compare housing estate condition present and future position after plans of reconstruction. Overall, it is evident from maps that there will be significnt development. The main change is in north side and one, two, three- bedroom houses resulting the dissapearence of four-bedroom houses. More detailed, at the present this place is residental […]

The maps show the changes of a small village from 1995 to present. Summarise the information by selecting and reporting the main features, and make comparisons where relevant.

The maps illustrate how a small village changed between 1995 and the present, focusing on alterations in its layout and facilities. Overall, the village has undergone considerable development, with farmland and natural areas being replaced by recreational facilities and residential buildings. In addition, commercial amenities have been upgraded to accommodate increased activity. In 1995, the […]

the plans below show the South Wing of Walton Museum in 2008 and 2012 after it was redeveloped. summarise the information by selecting and reporting the main features, and make comparison where relevant.

The plans illustrate how the layout of South Wing of Walton Museum changed from 2008 to 2012. Overall the part of the museum experienced significant transformation over the period, with introduction of new fasilities and rearangement of old blocks. The final development of the museum generally became more welcoming and toursit-frendly. In 2008, the site […]

The map below is of the town of Garlsdon. A new supermarket (S) is planned for the town. The map shows two possible sites for the supermarker. Summarise the information by selecting and reporting the main features, and make comparisons where relerant.

The map illustrates two potential locations (S1 and S2) for a new supermarket in the town of Garlsdon, which has a population of 65,000. Overall, the two sites differ significantly in terms of their surroundings and accessibility. S1 is situated in a rural area outside the main town, while S2 is located in the central […]

The two plans below show the City Library in 2004 and 2014.

The maps show differences in a city library structure between 2004 and 2014. Overall, the library exterior did not change, new Outdoor Performance area appeared behind the library. Both library wings changed significantly, especially the southern wing, which has been completely changed. In the 2004, there was reception desk next to the entrance and a […]

See All
We have detected unusual activity on your device.
Please verify your identity to continue.
Note: This verification step won't sign you in. If you have a premium account, please log in to access the service as usual.
Google/Gmail Verification
Or verify using Email/Code
We've sent a verification code to:
youremail@gmail.com (Not your email?)
Enter it below to complete the verification process.
Ensure your email address is correct, your inbox is not full, and you check your spam folder. If no email arrives, consider using an alternative email.
You will need a Premium plan to perform your action!
Note: If you already have a premium account, please log in to access our services as usual.

Plans & Pricing

Our mission is to make quality education accessible for everyone.
However, to keep our hardworking team running and this service alive, we genuinely need your support!
By opting for a premium plan, not only do you sustain us in achieving the mission, but you also unlock advanced features to enrich your learning experience.

Free

For learners who aren't pressed for time

What's included on Free
100+ Cambridge IELTS Tests
Instant IELTS Writing Task 1 & 2 Evaluation (2 times/month)
Instant IELTS Speaking Part 1, 2, & 3 Evaluation (5 times/month)
Instant IELTS Writing Task 1 & 2 Essay Generator (2 times/month)
500+ Dictation & Shadowing Exercises
100+ Pronunciation Exercises
Flashcards
Other Advanced Tools

Premium

For those serious about advancing their English proficiency, and for IELTS candidates aspiring to boost their band score by 1-2 points (especially in writing & speaking) in just 30 days or less

What's included on Premium
Save Your IELTS Test Progress
Unlock All Courses & IELTS Tests
Unlimited AI Conversations
Unlimited AI Writing Enhancement Exercises
Unlimited IELTS Writing Task 1 & 2 Evaluation
Unlimited IELTS Speaking Part 1, 2, & 3 Evaluation
Checked Answers Will Not Be Published
Unlimited IELTS Writing Task 1 & 2 Essay Generator
Unlimited IELTS Speaking Part 1, 2, & 3 Sample Generator
Unlimited Usage Of Advanced Tools
Priority Support within 24h (12-month plan only)

Due to the nature of our service and the provided free trials, payments are non-refundable.
Nếu bạn là người Việt Nam và không có hoặc không muốn trả bằng credit/debit cards, bạn có thể thanh toán bằng phương thức chuyển khoản:


Chọn gói:
419,000₫ 277,000 ₫ cho gói 1 tháng (chỉ 9,233₫/ngày)
1,239,000₫ 597,000 ₫ cho gói 3 tháng (chỉ 6,633₫/ngày)
2,469,000₫ 1,027,000 ₫ cho gói 6 tháng (chỉ 5,706₫/ngày)
4,929,000₫ 1,417,000 ₫ cho gói 12 tháng (chỉ 3,936₫/ngày)


Sau khi chuyển khoản, vui lòng đợi trình duyệt tự động điều hướng bạn trở lại Engnovate và bạn sẽ ngay lập tức nhận được mã kích hoạt tài khoản premium.
Nếu có lỗi xảy ra, bạn có thể liên hệ với team thông qua một trong các phương thức: email đến helloengnovate@gmail.com hoặc nhắn tin qua facebook.com/engnovate.
Vì toàn bộ công cụ trên website đều có thể sử dụng thử miễn phí, Engnovate không hỗ trợ hoàn tiền.