🔥 Today Only: Save 30% on Premium — Offer Ends Soon! - Upgrade Now!
Table

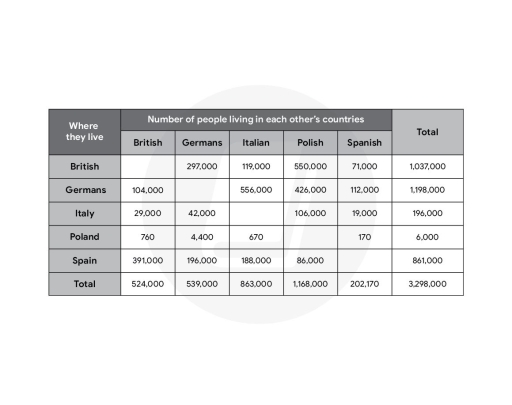
Band 7+: The table below provides information about the number of residents from five European countries living in each other's nations in 2011. Provide an overview of the information by identifying and describing the key details, and include comparisons where appropriate.

Image for topic: The table below provides information about the number of residents from five European countries living in each other's nations in 2011. Provide an overview of the information by identifying and describing the key details, and include comparisons where appropriate.
Our system will evaluate the answer based on this AI-generated description.
The image presents a table of population data showing people living in foreign countries, with columns labeled British, Germans, Italian, Polish, Spanish, and Total, while the rows are labeled as where they live: British, Germans, Italy, Poland, Spain; within the table, British: 297,000; Germans: 119,000; Italian: 550,000; Polish: 71,000; Spanish: 1,037,000; totals: Germans 104,000; British 556,000; Italian 426,000; Polish 112,000; Spanish 1,198,000; totals: Italy 29,000; British 42,000; Germans 106,000; Polish 19,000; Spanish 196,000; totals: Poland 760; British 4,000; Germans 670; Italian 170; Spanish 6,000; totals: Spain 391,000; British 196,000; Germans 188,000; Polish 86,000; totals 861,000; overall totals: 524,000 for British, 539,000 for Germans, 863,000 for Italian, 1,168,000 for Polish, 202,170 for Spanish, with a total of 3,298,000 across all categories.
Given the complexity of the image, the above description may not be entirely accurate.
Note: Both the topic and the answer were created by one of our users.

The given table details migration data for nationals from five European countries residing in the others’ nation for the year 2011. Overall, we see that from the sample set, the nation with the majority of immigration is Poland as we have the largest amount of immigrants living in the other four countries. Additionally, the country with the most number of expatriates is Germany with the highest non-citizen population from the sample set.

The most striking feature of this dataset is the number of non-nationals residing in Poland versus the number of Poles residing elsewhere. The significance of this is shown by the fact that of the roughly 3.3 million samples in the data, only 6000 non-Polish Europeans reside in Poland in contrast to the 1.168 million Poles who reside in the other European countries.

The country with the most European immigrants living within it’s jurisdiction is Germany with approximately 1.2 million residents who are not German. Residents who are nationals of Italy and Poland are the majority contributors to this.

Word Count: 170

Answers On The Same Topic:

The table below provides information about the number of residents from five European countries living in each other’s nations in 2011. Provide an overview of the information by identifying and describing the key details, and include comparisons where appropriate.

The table illustrates how many people from five European countries, namely British, Germany, Italy, Poland, and Spain, lived in each other’s nations, 2011. Overall, the total number of individuals from five European nations living in each other’s countries was 3,298,000. The British and Germany were the two most popular destinations, while Poland attracted the fewest […]

The table below provides information about the number of residents from five European countries living in each other’s nations in 2011. Provide an overview of the information by identifying and describing the key details, and include comparisons where appropriate.

The table compares the numbers of British, German, Italian, Polish and Spanish people who were living in each other’s countries in 2011. Overall, Germany and the UK hosted the largest numbers of foreign residents, whereas Poland had by far the smallest total. In terms of nationalities living abroad, Polish people formed the largest expatriate population, […]

The table below provides information about the number of residents from five European countries living in each other’s nations in 2011. Provide an overview of the information by identifying and describing the key details, and include comparisons where appropriate.

The table illustrates data about the number of residents from five European countries- namely British, Germans, Italy, Poland and Spain0 who live in each other’s nations in 2011. Overall, Germans was the most popular countries when the number of foreign visitors ranked first over other nations, while Poland was the least one but have the […]

The table below provides information about the number of residents from five European countries living in each other’s nations in 2011. Provide an overview of the information by identifying and describing the key details, and include comparisons where appropriate.

The table shows the number of people from five European countries living in one another’s nations in 2011. Overall, the UK and Germany were the most popular destinations for European residents, whereas Italy and Poland hosted relatively small numbers. In the UK, approximately 1.04 million Europeans were living there, with Poles forming the largest group […]

The table below provides information about the number of residents from five European countries living in each other’s nations in 2011. Provide an overview of the information by identifying and describing the key details, and include comparisons where appropriate.

In 2011 there was a study that showcased the number of Europeans living in each others countries , it is seen that the most popular destinations are the UK and Germany. The number of Europeans living the UK is a total of approximately 1,040,000 residents. The main population of these residents comes from Polish people […]

See All

Other Topics:

The chart below shows the primary hobbies of the adult residents in a small Tunisian town. Summarise the information by selecting and reporting the main features, and make comparisons where relevant.

The table illustrates the popularity shift of adult leisure activities in a small Tunisian town between 1980 and 2020. Overall, there were seven hobbies in total and the participation levels for these activities varied over the 40-year period. In 1980, the figures for watching TV and films, reading books, and going to the gym were […]

The tables below give information about sales of Fairtrade*-labelled tea and pineapples in 2010 and 2015 in five European countries.

the tables given illustrate the revenue made of sales of fairtrade-labelled tea and pineapple in five European countries for 2010 and 2015. The sales are measured in millions of euros. Overall, most of the countries made a considerable growth in sales for both categories. While France surged in tea sales between 2010 and 2015, Austria […]

The table below shows the amount of investment (in billion VND) allocated to different facilities and areas within a new tourism complex project near Hai Van Pass, Da Nang in 2026 and 2027. Summarise the information by selecting and reporting the main features, and make comparisons where relevant.

The provided table illustrates investment within a new tourism complex close to Hai Van Pass, Danang in 2026 and 2027, categorised by facilities and areas. Overall, hotels and resorts are projected to record the highest figures, whereas healthcare will continue to remain the facility with the lowest investment. Notably, investment allocation to most areas increased […]

The table below shows the results of an airline survey in 2002 of economy class business travellers. The numbers indicate how many male or female passengers in each age group rated a particular feature as their most important in-flight consideration. Summarise the information by choosing and reporting the key features, and make any relevant comparisons.

The table provides informatin about the results of an airline survey in 2002 of economy class and business class travellers. And it also mention that male and female passengers in each group rated a particular feature as their most important in-flight consideration. Overall, it is clear that seat comfort and legroom emerged as the most […]

The table shows information about students studying at an Australian university in 2009.

The table represents the popularity of different departments at a university in Australia in 2009, with a further classification by students’ gender, native languages, and nationality. Overall, female students preferred the humanities over science-related subjects, with the exception of physics. By contrast, science subjects held great appeal for students whose first language is not English […]

The three pie charts below show changes in annual spending at a public school in Canada in 1990, 2000, and 2010. Summarise the information by selecting and reporting the main features, and make comparisons where relevant.

The pie charts illustrate changes in the annual expenditure at a public school in Canada in three different years: 1990, 2000, and 2010. Overall, teachers’ salaries declined noticeably throughout the period; however, technology expenses increased significantly. Learning resources remained constant over the period. In 1990, teachers’ salaries accounted for more than half of expenditure at […]

See All
We have detected unusual activity on your device.
Please verify your identity to continue.
Note: This verification step won't sign you in. If you have a premium account, please log in to access the service as usual.
Google/Gmail Verification
Or verify using Email/Code
We've sent a verification code to:
youremail@gmail.com (Not your email?)
Enter it below to complete the verification process.
Ensure your email address is correct, your inbox is not full, and you check your spam folder. If no email arrives, consider using an alternative email.
You will need a Premium plan to perform your action!
Note: If you already have a premium account, please log in to access our services as usual.

Plans & Pricing

Our mission is to make quality education accessible for everyone.
However, to keep our hardworking team running and this service alive, we genuinely need your support!
By opting for a premium plan, not only do you sustain us in achieving the mission, but you also unlock advanced features to enrich your learning experience.

Free

For learners who aren't pressed for time

What's included on Free
100+ Cambridge IELTS Tests
Instant IELTS Writing Task 1 & 2 Evaluation (2 times/month)
Instant IELTS Speaking Part 1, 2, & 3 Evaluation (2 times/month)
Instant IELTS Writing Task 1 & 2 Essay Generator (2 times/month)
500+ Dictation & Shadowing Exercises
100+ Pronunciation Exercises
Flashcards
Other Advanced Tools

Premium

For those serious about advancing their English proficiency, and for IELTS candidates aspiring to boost their band score by 1-2 points (especially in writing & speaking) in just 30 days or less

What's included on Premium
Save Your IELTS Test Progress & Analyze Mistakes By Question Type
Save Your Own Flashcard Sets & Use Them On Any Device
Unlock All Courses, IELTS Tests, Section & Part Practice
Unlimited AI Conversations
Unlimited AI Writing Enhancement Exercises
Unlimited IELTS Writing Task 1 & 2 Evaluation
Unlimited IELTS Speaking Part 1, 2, & 3 Evaluation
Checked Answers Will Not Be Published
Unlimited IELTS Writing Task 1 & 2 Essay Generator
Unlimited IELTS Speaking Part 1, 2, & 3 Sample Generator
Unlimited Usage Of Advanced Tools & AI Features
Priority Support within 24h (12-month plan only)

Due to the nature of our service and the provided free trials, payments are non-refundable.