🔥 Today Only: Save 30% on Premium — Offer Ends Soon! - Upgrade Now!
Table

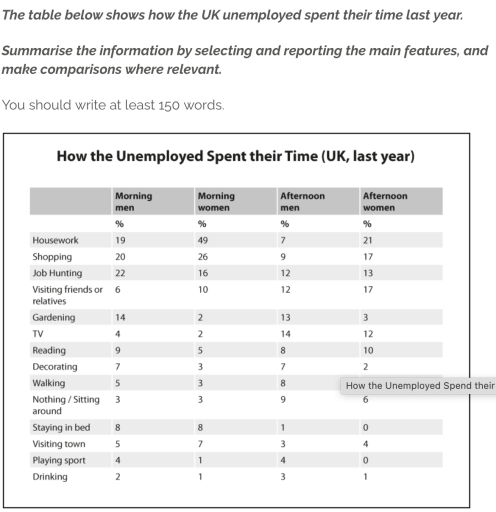
Band 4+: The table below shows how the UK unemployed spent their time last year. Summarise the information by selecting and reporting the main features, and make comparisons where relevant.

Image for topic: The table below shows how the UK unemployed spent their time last year. Summarise the information by selecting and reporting the main features, and make comparisons where relevant.
Our system will evaluate the answer based on this AI-generated description.
The image presents a table showing how unemployed people in the UK spent their time last year, listing different activities comparing morning and afternoon data between men and women. Morning activities for men include housework (1%), shopping (20%), job hunting (22%), visiting friends or relatives (6%), gardening (14%), TV watching (4%), reading (5%), decorating (7%), walking (5%), nothing/sitting around (3%), staying in bed (8%), visiting town (5%), playing sport (4%), and drinking (2%). Afternoon activities for men include housework (7%), shopping (12%), job hunting (9%), visiting friends or relatives (12%), gardening (3%), TV (14%), reading (8%), decorating (7%), walking (8%), nothing/sitting around (3%), staying in bed (1%), visiting town (4%), playing sport (1%), and drinking (3%). Morning activities for women include housework (19%), shopping (26%), job hunting (4%), visiting friends or relatives (10%), gardening (2%), TV (2%), reading (20%), decorating (3%), walking (5%), nothing/sitting around (3%), staying in bed (8%), visiting town (5%), playing sport (4%), and drinking (2%). Afternoon activities for women include housework (4%), shopping (17%), job hunting (13%), visiting friends or relatives (7%), gardening (1%), TV (12%), reading (10%), decorating (5%), walking (4%), nothing/sitting around (6%), staying in bed (0%), visiting town (4%), playing sport (0%), and drinking (1%).
Given the complexity of the image, the above description may not be entirely accurate.
Note: Both the topic and the answer were created by one of our users.

The table provides the information how the unemployed individuals on United Kingdom wasted their time over last twelve months.

Overall, the large propotion of female and male engaged in job hunting and housework accordingly , while the least persantage of them spent to drinking for women and staying in the bed for men.

To be more specific , the majority of morning female allocated their

time to house work and shopping which was equal to forty nine percent and twenty six percent respectively. Similarly, morning men demostrated the highest percent in spending their time to job hunting which equevalented to 22 percent. In contrast , morning male and female were least interested in drinking with only 1 percent difference.

Turning to afternoon men and women , the female made up third of all propotion to housework , while for male it was in over 7 percent. Likewise , the afternoon female had a same percentage in shopping and visiting friends or relative with 17 percent .Meanwhile, the afternoon male decpicted a same proportion in job humling with visiting friends and visiting town and drinking which accounted for 12 percent and 3 percent respectively.Convrsely , the lowest percantage for afternoon men amd women saw in staying in the bed and playing sport equevalenting to 1 and 0 percent accordingly.

Word Count: 218

Answers On The Same Topic:

The table below shows how the UK unemployed spent their time last year. Summarise the information by selecting and reporting the main features, and make comparisons where relevant.

The given table illustrates the percentage of time that unemployed individuals in both genders spent on various activities during the previous year in the UK. Overall, it is obvious that both men and women ran errands and searched for jobs in the morning while leaving recreational activities for the afternoon. Regarding the tasks in a […]

The table below shows how the UK unemployed spent their time last year. Summarise the information by selecting and reporting the main features, and make comparisons where relevant.

The table illustrates how the unoccupied men and women spent their morning and afternoon time of day in Uk last year.The information are stated in percentage of people. Overall, Men in morning spent most of their time in job hunting and in afternoon watching TV whereas, Women spent start and mid of the day in […]

The table below shows how the UK unemployed spent their time last year. Summarise the information by selecting and reporting the main features, and make comparisons where relevant.

The provided table illustrates the percentages of unemployed people spending their time on various listed categories, classified by genders in the UK the previous year. Looking from an overall perspective, it is readily apparent that women spent most of their time on household chores in both morning and afternoon. Additionally, job hunting was the activity […]

The table below shows how the UK unemployed spent their time last year. Summarise the information by selecting and reporting the main features, and make comparisons where relevant.

The table indicates how people who are out of work in the United Kingdom used their time in the prior year. The graph is divided into two portions of the day and 14 activities. Overall, contrary to popular beliefs, unemployed people spent most of their time doing productive chores. They also spent little time on […]

The table below shows how the UK unemployed spent their time last year. Summarise the information by selecting and reporting the main features, and make comparisons where relevant.

The table illustrates the distribution of time spent on various activities by unemployed individuals in the United Kingdom over the past year. A notable distinction arises between male and female participants in terms of their engagement in diverse activities, with job hunting and housework dominating the agendas, while minimal time was allocated to drinking and […]

See All

Other Topics:

the table below gives information about the changes in the military budgets of 8 countries between 2004 and 2020

The table shows how much money were in military budgets in eight different countries in 2004 and 2020. In general, almost all country budgets trended upwards, the only nations which bucked down were the United Kingdom and Italy. It is worth mentioning that, the United States stood out with the highest amount of money while […]

The table shows the number of international students from five different countries who enrolled in a university in the UK in 2018 and 2022.

The table provides information about the number of students from five countries who enrolled at a UK university in 2018 and 2022 Overall,the number of students from most countries increased in 2022 compared with 2018.The biggest number of international students came from China in both years,while the number of students from Brazil was the lowest. […]

The table below shows the percentage of people in four age groups who used three types of social media in a country in 2010 and 2025.

The table illustrates the percentage of people in four different age groups who used three types of social media in a certain country over a 15-year period. Overall, people aged 18-24 recorded the highest proportion of social networking users in 2025, while people aged 50 and over showed the slowest percentage of professional networking in […]

The table below presents the food consumption per weekly in aEuropean country in 1992, 2002 and 2012.

The table illustrates the weekly consumption of five types of food, namely vegetables, meat, wheat, beans and cheese, per person in a European country in 1992, 2002 and 2012. Overall, vegetables were by far the most widely consumed food throughout the period, whereas cheese had the lowest figures. The consumption of vegetables, wheat and beans […]

The table below shows the consumption of three basic foods (wheat, maize, rice) by people in four different countries.

The table compares the consumption of three basic foods, which are wheat, maize and rice, by people, measured in calories per person per day, in four different countries. Overall, it is clear that the highest consumption of wheat was recorded at both Poland and Egypt. However, in Cambodia the consumption of rice was the dominant […]

The table shows questionnaires about the opinions of club members and general public for the new theater in one town in 2012.

The table shows opinions about new theater questioned by club members and general public in 2012. Overall, club members gave more positive ratings for facilities and quality, whereas the general public rated information more favourably. Quality recieved the lowest proportion of poor ratings, while information had the highest figure of people who choosed it to […]

See All
We have detected unusual activity on your device.
Please verify your identity to continue.
Note: This verification step won't sign you in. If you have a premium account, please log in to access the service as usual.
Google/Gmail Verification
Or verify using Email/Code
We've sent a verification code to:
youremail@gmail.com (Not your email?)
Enter it below to complete the verification process.
Ensure your email address is correct, your inbox is not full, and you check your spam folder. If no email arrives, consider using an alternative email.
You will need a Premium plan to perform your action!
Note: If you already have a premium account, please log in to access our services as usual.

Plans & Pricing

Our mission is to make quality education accessible for everyone.
However, to keep our hardworking team running and this service alive, we genuinely need your support!
By opting for a premium plan, not only do you sustain us in achieving the mission, but you also unlock advanced features to enrich your learning experience.

Free

For learners who aren't pressed for time

What's included on Free
100+ Cambridge IELTS Tests
Instant IELTS Writing Task 1 & 2 Evaluation (2 times/month)
Instant IELTS Speaking Part 1, 2, & 3 Evaluation (2 times/month)
Instant IELTS Writing Task 1 & 2 Essay Generator (2 times/month)
500+ Dictation & Shadowing Exercises
100+ Pronunciation Exercises
Flashcards
Other Advanced Tools

Premium

For those serious about advancing their English proficiency, and for IELTS candidates aspiring to boost their band score by 1-2 points (especially in writing & speaking) in just 30 days or less

What's included on Premium
Save Your IELTS Test Progress & Analyze Mistakes By Question Type
Save Your Own Flashcard Sets & Use Them On Any Device
Unlock All Courses, IELTS Tests, Section & Part Practice
Unlimited AI Conversations
Unlimited AI Writing Enhancement Exercises
Unlimited IELTS Writing Task 1 & 2 Evaluation
Unlimited IELTS Speaking Part 1, 2, & 3 Evaluation
Checked Answers Will Not Be Published
Unlimited IELTS Writing Task 1 & 2 Essay Generator
Unlimited IELTS Speaking Part 1, 2, & 3 Sample Generator
Unlimited Usage Of Advanced Tools & AI Features
Priority Support within 24h (12-month plan only)

Due to the nature of our service and the provided free trials, payments are non-refundable.