🔥 Today Only: Save 30% on Premium — Offer Ends Soon! - Upgrade Now!
Table

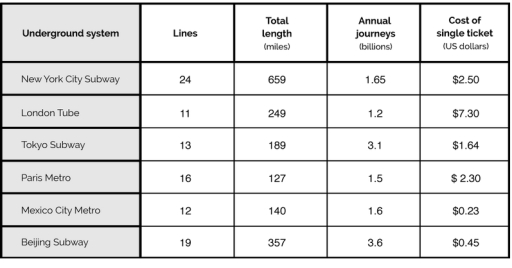
Band 6+: The table below shows information about metro systems in six different cities. Summarise the information by selecting and reporting the main features and make comparisons where relevant.

Image for topic: The table below shows information about metro systems in six different cities. Summarise the information by selecting and reporting the main features and make comparisons where relevant.
Our system will evaluate the answer based on this AI-generated description.
The image displays a table comparing key statistics across six major underground transit systems. It includes the following data for each: New York City Subway has 24 lines, a total network length of 659 miles, annual journeys totaling 1.65 billion, and a single ticket cost of $2.50. London Tube features 11 lines, 249 miles of track, 1.2 billion annual journeys, and a ticket price of $7.30. Tokyo Subway consists of 13 lines, spans 189 miles, sees 3.1 billion journeys per year, and charges $1.64 per ticket. Paris Metro operates 16 lines over 127 miles, accommodates 1.5 billion annual journeys, with tickets priced at $2.30. Mexico City Metro has 12 lines covering 140 miles, 1.6 billion journeys annually, and a minimal ticket cost of $0.23. Beijing Subway includes 19 lines, 357 miles long, 3.6 billion annual journeys, and a ticket priced at $0.45.
Given the complexity of the image, the above description may not be entirely accurate.
Note: Both the topic and the answer were created by one of our users.

The data about underground metro transportation in six major cities is tabulated. The six cities comprises of New York, London, Tokyo, Paris, Mexico City and Beijing. The presented information includes; the number of line, the total length in miles, the annual passengers in billion. and finally the cost of a single ticket in US dollars.

Overall, New York’s subway seems to have the most expansive network both in length and lines, Although subway in Beijing caters to more people.

Looking into more detail the subway in New York has about 24 lines which is more than twice that of the capital of England, which lies at the bottom in terms of lines. Although, It does seem to cover much more distance, a 249 miles, then all the other cities, except for New York’s and Beijing’s subways, even while having fewer stations then them.

The cheapest public transport system out of the six presented is in Mexico City. which is is $0.23, a stellar more than 7 dollars cheaper then London whose cost $7.30 dollars. Finally Beijing and Tokyo are the only cities that have over 3 billion users while all the rest are below 2.

Word Count: 195

Answers On The Same Topic:

The table below shows information about metro systems in six different cities. Summarise the information by selecting and reporting the main features and make comparisons where relevant.

The data presents information underground system of the metro in six different cities. Overall, the underground metro system displayed in the data includes the lines, the total length in miles, annual journeys in billions, and the cost of a single ticket in us dollars. City names are New York City subway, London Tube, Tokyo Subway, […]

The table below shows information about metro systems in six different cities. Summarise the information by selecting and reporting the main features and make comparisons where relevant.

The table provides data on metro systems in six cities, comparing their network size, passenger volume, and ticket costs. Overall, metro systems with larger networks do not necessarily have higher passenger numbers or fares. Notably, Beijing and Tokyo have the busiest systems, while London has the most expensive tickets despite a smaller network. New York […]

The table below shows information about metro systems in six different cities. Summarise the information by selecting and reporting the main features and make comparisons where relevant.

The table illustrates the number of major metro system total length, carrying capacity, And completed years in six different countries. It is evident from the observation that, london build train in 1863 and the oldest train, it coverd 1100 kilometres and they carry 548 millions passengers. Likewise, the second oldest system is also the second […]

The table below shows information about metro systems in six different cities. Summarise the information by selecting and reporting the main features and make comparisons where relevant.

This graph illustrates a metro system in six different cities: London, Tokyo, Paris,Mexico, Beijing. Futermore, each colume includes information about lines, total length, annual journeys and cost of single ticket. We can see that city which have the most lines it is New York which have 24 points. Also, New York metro is the longest […]

The table below shows information about metro systems in six different cities. Summarise the information by selecting and reporting the main features and make comparisons where relevant.

The table compares six major metro systems across the world in terms of the number of lines, total length, annual ridership, and single ticket cost. Overall, New York City has the longest and most extensive metro network, while Beijing has the highest number of annual journeys. The cost of a single ticket varies significantly, with […]

See All

Other Topics:

You should spend about 20 minutes on this task. The table illustrates the popularity of five distinct beef types (Belgian Blue, Holstein, Simmental, Scotch, Aberdeen Angus) across different European countries. Summarise the data by highlighting key features and drawing relevant comparisons as necessary.

The table shows the popularity of five types of beef in different countries in Europe. Overall, Belgian blue was the most popular type of beef Italy, France, and Germany, while scotch and simmental types recorded the lowest proportion in all countries. Belgian blue type recorded the highest proportion, reaching 42 percent in Italy, 37 percent […]

The chart below shows the percentage of household spending on four categories in three countries in 2015. Summarise the information by selecting and reporting the main features, and make comparisons where relevant.

The chart presents how the proportion of household expenses differ in three countries by four categoties in 2015. The majority of spendings refer to food and housing in each country. The second place in the rate of expenses is really diffrent in each country. In country A and C people spend around one-fourth of budget […]

The table below shows the information about spending on health in five different countries in 2002. Summarise the information by selecting and reporting the main features, and make comparisons where relevant.

The given table illustrates the proportion of GDP allocated to healthcare in five nations, namely Japan, Italy, Germany, France, and the USA, in 2002. Overall, France’s total health spending was higher than that of the other four countries, whereas Japan recorded the lowest figure. In addition, in all five countries, public spending on health considerably […]

The table below shows the information about spending on health in five different countries in 2002. Summarise the information by selecting and reporting the main features, and make comparisons where relevant.

The given table illustrates the proportion of GDP allocated to healthcare in five nations, namely Japan, Italy, Germany, France, and the USA, in 2002. Overall, France’s total health spending was higher than that of the other four countries, whereas Japan recorded the lowest figure. In addition, in all five countries, public spending on health considerably […]

The table below shows the percentage of first year students who gave "very good" rating to the resources provided by the college, for three courses.

The presented table demonstrates first-year college learners who assessed ‘very good’ to various resources given by the university for economics, law, and commerce. The units are measured in percentages. Overall, tutor’s ratings surpassed all other categories in terms of average assessments by students. Additionally, commerce learners showed extremely high percentages of those voting ‘very good’ […]

TASK 1: The table shows the production of milk annually in four countries in 1990, 2000 and 2010.

The table compares the difference of milk production in four different countries over 3-decade. Overall, Netherlands recorded the most produced of milk compared to Australia, Tanzania, and Guatemala. Australia’s milk production fell sharply in each decades, whereas Tanzania and Guatemala experienced significant increases over the same period. Netherlands recorded the most mass-produce of milk for […]

See All
We have detected unusual activity on your device.
Please verify your identity to continue.
Note: This verification step won't sign you in. If you have a premium account, please log in to access the service as usual.
Google/Gmail Verification
Or verify using Email/Code
We've sent a verification code to:
youremail@gmail.com (Not your email?)
Enter it below to complete the verification process.
Ensure your email address is correct, your inbox is not full, and you check your spam folder. If no email arrives, consider using an alternative email.
You will need a Premium plan to perform your action!
Note: If you already have a premium account, please log in to access our services as usual.

Plans & Pricing

Our mission is to make quality education accessible for everyone.
However, to keep our hardworking team running and this service alive, we genuinely need your support!
By opting for a premium plan, not only do you sustain us in achieving the mission, but you also unlock advanced features to enrich your learning experience.

Free

For learners who aren't pressed for time

What's included on Free
100+ Cambridge IELTS Tests
Instant IELTS Writing Task 1 & 2 Evaluation (2 times/month)
Instant IELTS Speaking Part 1, 2, & 3 Evaluation (2 times/month)
Instant IELTS Writing Task 1 & 2 Essay Generator (2 times/month)
500+ Dictation & Shadowing Exercises
100+ Pronunciation Exercises
Flashcards
Other Advanced Tools

Premium

For those serious about advancing their English proficiency, and for IELTS candidates aspiring to boost their band score by 1-2 points (especially in writing & speaking) in just 30 days or less

What's included on Premium
Save Your IELTS Test Progress & Analyze Mistakes By Question Type
Save Your Own Flashcard Sets & Use Them On Any Device
Unlock All Courses, IELTS Tests, Section & Part Practice
Unlimited AI Conversations
Unlimited AI Writing Enhancement Exercises
Unlimited IELTS Writing Task 1 & 2 Evaluation
Unlimited IELTS Speaking Part 1, 2, & 3 Evaluation
Checked Answers Will Not Be Published
Unlimited IELTS Writing Task 1 & 2 Essay Generator
Unlimited IELTS Speaking Part 1, 2, & 3 Sample Generator
Unlimited Usage Of Advanced Tools & AI Features
Priority Support within 24h (12-month plan only)

Due to the nature of our service and the provided free trials, payments are non-refundable.
Nếu bạn là người Việt Nam và không có hoặc không muốn trả bằng credit/debit cards, bạn có thể thanh toán bằng phương thức chuyển khoản:


Chọn gói:
419,000₫ 277,000 ₫ cho gói 1 tháng (chỉ 9,233₫/ngày)
1,239,000₫ 597,000 ₫ cho gói 3 tháng (chỉ 6,633₫/ngày)
2,469,000₫ 1,027,000 ₫ cho gói 6 tháng (chỉ 5,706₫/ngày)
4,929,000₫ 1,417,000 ₫ cho gói 12 tháng (chỉ 3,936₫/ngày)


Sau khi chuyển khoản, vui lòng đợi trình duyệt tự động điều hướng bạn trở lại Engnovate và bạn sẽ ngay lập tức nhận được mã kích hoạt tài khoản premium.
Nếu có lỗi xảy ra, bạn có thể liên hệ với team thông qua một trong các phương thức: email đến helloengnovate@gmail.com hoặc nhắn tin qua facebook.com/engnovate.
Vì toàn bộ công cụ trên website đều có thể sử dụng thử miễn phí, Engnovate không hỗ trợ hoàn tiền.