Our system will evaluate the answer based on this AI-generated description.
The image is a table with five rows and five columns. The first column headers are "Male employees," "Female employees," "Total employees," and "Factories." The rows are labeled with years 1851 to 1901 in increments of 10 years. In 1851, male employees were 287,100, female employees were 190,000, total employees were 477,100, and there were 225 factories. In 1861, male employees dropped to 131,780, female employees to 160,000, total employees to 291,780, and factories increased to 227. By 1871, male employees decreased to 80,123, female employees to 60,000, total to 140,123, and a significant jump in factories to 622. In 1881, male employees were 76,132, female employees at 50,000, total employees at 126,132, and factories rose to 721. By 1891, male employees fell to 65,000, female to 40,000, total to 105,000, and factories dropped to 625. Finally, in 1901, male employees were 31,000, female employees at 30,000, total employees at 61,000, and factories reduced to 600.
Given the complexity of the image, the above description may not be entirely accurate.
Skyrocket your IELTS band score by 1-2 points in under a month with our premium plan!
Note: Both the topic and the answer were created by one of our users.
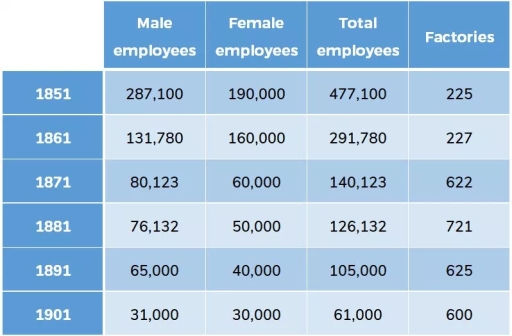
The table compares how many employees and factories produced silk in England and Wales each decade from 1851 to 1901. Looking from an overall perspective, it is readily apparent that the number of total people who made silk decreased, while factories increased their manufacture and fluctuated between 600 and 700.
It is clear that the total number of 130,750 people was the peak for employees in 1851, which fell to 38,942 by the end of the provided period. However, during 50 years the females were dominant over males. As for factories, the lowest count of them was recorded as 272 in 1851. Then, it rose to 761 in the next ten years, reaching the highest point throughout time, after which it vacillated between 623 and 702.
Over the following 40 years, the total number of female and male workers gradually decreased throughout the period. Meanwhile, the number of silk factories experienced a gradual decline over these years, from 761 in 1861 to 623 in 1901.
Word Count: 165