Our system will evaluate the answer based on this AI-generated description.
The image is a table with five rows and five columns. The first column headers are "Male employees," "Female employees," "Total employees," and "Factories." The rows are labeled with years 1851 to 1901 in increments of 10 years. In 1851, male employees were 287,100, female employees were 190,000, total employees were 477,100, and there were 225 factories. In 1861, male employees dropped to 131,780, female employees to 160,000, total employees to 291,780, and factories increased to 227. By 1871, male employees decreased to 80,123, female employees to 60,000, total to 140,123, and a significant jump in factories to 622. In 1881, male employees were 76,132, female employees at 50,000, total employees at 126,132, and factories rose to 721. By 1891, male employees fell to 65,000, female to 40,000, total to 105,000, and factories dropped to 625. Finally, in 1901, male employees were 31,000, female employees at 30,000, total employees at 61,000, and factories reduced to 600.
Given the complexity of the image, the above description may not be entirely accurate.
Skyrocket your IELTS band score by 1-2 points in under a month with our premium plan!
Note: Both the topic and the answer were created by one of our users.
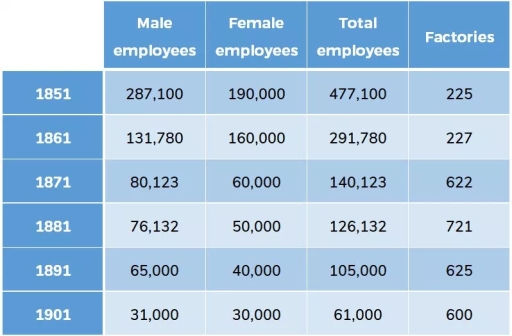
The table demonstrates the major of employees and factories producing silk in England and Wales from 1851 to 1901, measured in person.
From an overall perspective, the number of females outweighs males during this period. Both genders follow the same decreasing trend, showing a decline in total employees each year, while the quanity of factories increases significantly.
According to the data, it can be seen that some of the underlying causes of the reduction in total employees stem from a drop in both male and female workers. In 1851, males and females contributed about 53,964 and 76,786 persons to the total workforce, respectively. In the next year, the numbers of males and females dropped dramatically to approximately 41,936 and 67,933 persons. By 1871, 38,102 males and 53,310 females were part of the total labor force. This trend continued until 1901, by which time there were only 13,375 males and 25,567 females making up the total workforce.
On the other hand, while the above figures decreased over time, the number of factories was the only figure to follow an increasing trend. In 1851, there were about 272 workshops. However, in the following years, this number grew significantly to 761 in 1861, 693 in 1871, 702 in 1881, 663 in 1891, and 623 in 1901.
Word Count: 213