Our system will evaluate the answer based on this AI-generated description.
The image is a table with five rows and five columns. The first column headers are "Male employees," "Female employees," "Total employees," and "Factories." The rows are labeled with years 1851 to 1901 in increments of 10 years. In 1851, male employees were 287,100, female employees were 190,000, total employees were 477,100, and there were 225 factories. In 1861, male employees dropped to 131,780, female employees to 160,000, total employees to 291,780, and factories increased to 227. By 1871, male employees decreased to 80,123, female employees to 60,000, total to 140,123, and a significant jump in factories to 622. In 1881, male employees were 76,132, female employees at 50,000, total employees at 126,132, and factories rose to 721. By 1891, male employees fell to 65,000, female to 40,000, total to 105,000, and factories dropped to 625. Finally, in 1901, male employees were 31,000, female employees at 30,000, total employees at 61,000, and factories reduced to 600.
Given the complexity of the image, the above description may not be entirely accurate.
Skyrocket your IELTS band score by 1-2 points in under a month with our premium plan!
Note: Both the topic and the answer were created by one of our users.
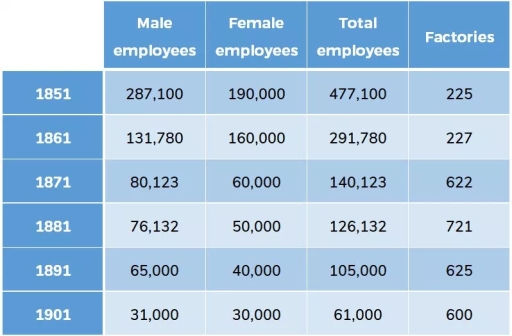
The table illustrates the number of employees and factories producing silk in England and Wales over a span of 50 years, from 1851 to 1901.
The total employee count steadily decreased during this period, dropping from 130,750 in 1851 to 38,942 in 1901. In contrast, the number of factories experienced a sharp increase between 1851 and 1861, nearly tripling from 272 to 761. After this significant rise, the number of factories fluctuated between 623 and 761 until 1901.
Although the number of employees declined considerably over these years, the gender distribution did not change dramatically. Females consistently dominated the workforce, representing 60 percent of silk production employees. The female workforce started at 76,786 and decreased to 25,567 after 50 years, while the male count fell from 53,964 to just 13,375. Notably, in every decade, the number of female employees exceeded that of male employees.
In conclusion, we can observe a decline in the workforce in the silk production industry during the second half of the 19th century, contrasting with the rise in the number of factories. This trend may indicate a lack of foresight among factory owners regarding the sustainability of their operations.
Word Count: 193