Our system will evaluate the answer based on this AI-generated description.
The image exhibits a line graph titled 'Obesity Rate (by age)' with years on the x-axis ranging from 1971 to 2005 and percent on the y-axis from 0 to 45. There are four labeled trend lines: 18-29, 30-44, 45-64, and 65-74. The 18-29 age group starts at approximately 5% in 1971, gradually increasing to 15% in 1988, then to 17.5% in 1999, and reaching just over 17.5% in 2005. The 30-44 age group begins around 12.5% in 1971, escalating to 25% in 1988, surging to just below 35% in 1999, and peaking around 37.5% in 2005. The 45-64 segment initiates at just below 15% in 1971, climbing to just below 30% in 1988, soaring to approximately 37.5% in 1999, and attaining nearly 40% in 2005. Lastly, the 65-74 cohort commences at roughly 12.5% in 1971, advances to just below 20% in 1988, amplifies to just over 20% in 1999, and culminates at 22.5% in 2005.
Given the complexity of the image, the above description may not be entirely accurate.
Skyrocket your IELTS band score by 1-2 points in under a month with our premium plan!
Note: Both the topic and the answer were created by one of our users.
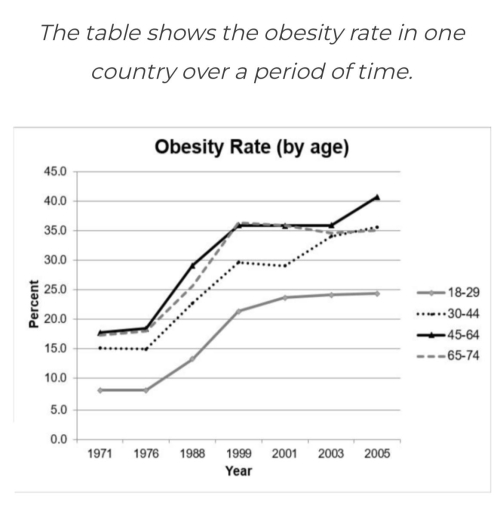
The line graph gives information on the obesity rate in one country by age from 18 to 74 years old over 24 years. Overall, there was an upward trend of obesity rate for every age over the timeframe. Units are measured in percent.
The age groups of 45-64 and 65-74 experienced a similar pattern through the years. Starting at the same point about 17,5% in 1971, these figures experienced a rapid growth rate to above 35% in 1999. From that period the obesity rate for these two groups remained constant at approximately 35%. Then between 2003 and 2005, the 45-64 age group rose to around 41%, with the 65-74 age group indicating no significant difference to the latter.
Interestingly, the age group 18-29 and 30-44 were the categories with the lowest rate of overweight for the following years. Starting just under 9% and 15% respectively, these figures fluctuated and increased significantly to around 21% and 30% in 1999. From this point, the 18-29 age group remained stable contribution at 24% by 2005, while the 30-44 got a moderate increase to 35% in 2003 and then steady at that point until 2005.
Word Count: 191
