Our system will evaluate the answer based on this AI-generated description.
The image shows two tables comparing people's perceptions of various aspects of living conditions in 1980 and 2010. In 1980, the percentages for "good" are: education (72), healthcare (82), environment (72), shops (64), employment (62), and transport (52). The "neither good nor bad" percentages are: education (23), healthcare (20), environment (22), shops (22), employment (22), and transport (16). The "bad" percentages are: education (5), healthcare (8), environment (6), shops (10), employment (10), and transport (32). In 2010, the "good" percentages are: education (82), healthcare (74), environment (71), shops (60), employment (72), and transport (39). The "neither good nor bad" percentages are: education (11), healthcare (14), environment (13), shops (24), employment (5), and transport (23). The "bad" percentages are: education (9), healthcare (12), environment (16), shops (16), employment (23), and transport (38).
Given the complexity of the image, the above description may not be entirely accurate.
Skyrocket your IELTS band score by 1-2 points in under a month with our premium plan!
Note: Both the topic and the answer were created by one of our users.
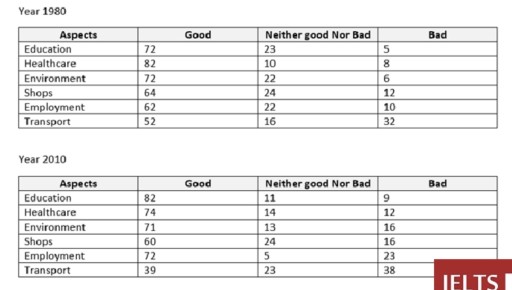
The table illustrates proportions of 2 surveys done on different aspects of city living in a specific city between 1980 and 2010.
Overall, these 6 aspects were classified among good ,neither good nor bad and bad where there was various variations in the given period. In some fields, Good proportions rose. However the bad percentage in all fields increased in 2010.
Good percentage remained the highest among the 3 categories. Though, there was a slight decrease in 2010 of 8%, 1%, 4% and 13% in healthcare, environment, shops and transport respectively. In contrast bad percentage leveled up from 1980 to 2010 in all categories especially for environment which started at 6% in 1980 and ended with 16% in 2010 and same for employment from 10% to 23% in 2010.
On the other hand, employment witnessed a sharp decrease where it represented initially 22% to reach 5% in 2010. But shops stayed stable throughout the period and for the rest of fields they all faced a slight drop except for healthcare that grew gradually.
Word Count: 173