🔥 Today Only: Save 30% on Premium — Offer Ends Soon! - Upgrade Now!
Table

Band 8+: The tables show results of 2 surveys done in 1980 and 2010 on various aspects of city living in a particular city. Units are measured in percentage.

Image for topic: The tables show results of 2 surveys done in 1980 and 2010 on various aspects of city living in a particular city. Units are measured in percentage.
Our system will evaluate the answer based on this AI-generated description.
The image shows two tables comparing people's perceptions of various aspects of living conditions in 1980 and 2010. In 1980, the percentages for "good" are: education (72), healthcare (82), environment (72), shops (64), employment (62), and transport (52). The "neither good nor bad" percentages are: education (23), healthcare (20), environment (22), shops (22), employment (22), and transport (16). The "bad" percentages are: education (5), healthcare (8), environment (6), shops (10), employment (10), and transport (32). In 2010, the "good" percentages are: education (82), healthcare (74), environment (71), shops (60), employment (72), and transport (39). The "neither good nor bad" percentages are: education (11), healthcare (14), environment (13), shops (24), employment (5), and transport (23). The "bad" percentages are: education (9), healthcare (12), environment (16), shops (16), employment (23), and transport (38).
Given the complexity of the image, the above description may not be entirely accurate.
Note: Both the topic and the answer were created by one of our users.

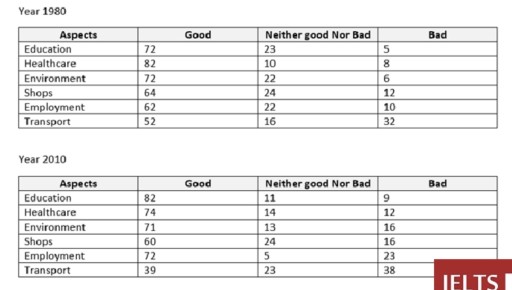
The table illustrates the results of two surveys conducted in 1980 and 2010 in a city to assess six different aspects of city life. The response was recorded in terms of the percentage of people. Overall, education, healthcare, and the environment received the highest score in both years, whereas transport was rated the lowest. Meanwhile, education’s rating rose, while that of transportation fell.

In 1980, health care received the highest rating, with over 80 percent of people approving, while education and environment both scored 72%. Under 10% people rated these sections as bad. For shops and employment, 60-64 people approved them as good. Meanwhile, around half of the people rated transportation in the good category, and nearly one-third of the responders rated it bad.

Turning to 2010, education’s rating was raised to 82%, while that of healthcare decreased to 74%. The score for employment also went up by 10%, with 72% people happy with this sector. The response of people about shops and environmental aspects remained relatively unchanged. The scores for transportation fell further; 39% responders rated it good, 38% bad, and 23% remained neutral.

Word Count: 185

Answers On The Same Topic:

The tables show results of 2 surveys done in 1980 and 2010 on various aspects of city living in a particular city. Units are measured in percentage.

The two tables demonstrate results of 2 surveys about multiple aspects of urban life in various cities in two years (1980 and 2010). Overall, it is clear that in the first year healthcare aspect topped the list of good ones, whereas transport sector ranked first as a bad one. However, in 2010 education got by […]

The tables show results of 2 surveys done in 1980 and 2010 on various aspects of city living in a particular city. Units are measured in percentage.

The two tables illustrate the outcomes of 2 surveys done in 1980 and 2010 based on residents opinions on six aspects on city life.Data was mesured with percentage and devided on three aspects Good ,neither good nor bad and bad. Overall,most of aspets received from citizens was good.although sevrale showed notable changes over time.Education and […]

The tables show results of 2 surveys done in 1980 and 2010 on various aspects of city living in a particular city. Units are measured in percentage.

The given table delineates the level of satisfaction in various dimmensions of city dwellers in a typical city. Upon initial observation, it is prominent that most of the surveyees had a positive feedback with the quality of educaiton and healthcare systems while the same cannot be said for the transport system, which received the lees […]

The tables show results of 2 surveys done in 1980 and 2010 on various aspects of city living in a particular city. Units are measured in percentage.

The table illustrates proportions of 2 surveys done on different aspects of city living in a specific city between 1980 and 2010. Overall, these 6 aspects were classified among good ,neither good nor bad and bad where there was various variations in the given period. In some fields, Good proportions rose. However the bad percentage […]

See All

Other Topics:

The table provides information about household budgets in a European country from 1920 to 1980. Provide an overview of the information by identifying and describing the key details, and include comparisons where appropriate.

The given table presents the domestic budget in a European nation between 1920 and 1980. Overall, the majority of categories exhibited a net upward trend, particularly in the household expenditure for transportation. Additionally, despite food absorbing the highest proportion of income, its position was overtaken by that of housing by the end of the period. […]

The table provides information about household budgets in a European country from 1920 to 1980. Provide an overview of the information by identifying and describing the key details, and include comparisons where appropriate.

The given table presents the domestic monetary allocation in a European nation between 1920 and 1980. Overall, the majority of categories exhibited a net upward trend, particularly in the household expenditure for transportation. Additionally, despite food being the initially biggest contributor, its position was overtaken by that of housing by the end of the period. […]

The table shows the percentage of government expenditure on health care in five countries in 2006 as well as the proportions of 24-30-year-olds working in medical services. Summarize the information by selecting and reporting the main features, and make comparisons where relevant.

The table chart illustrate the percentage of government spending on health service in 5 different countries, namely Poland, Finland, Iceland, Spain, and Italy. Also it shows the proportions of 24-30-year-olds working in medical related jobs. Overall, the percentage of government expenditure on health care in Italy was dominant, and Poland followed an opposite percent. Surprisingly, […]

the chart below shows the information about three different deserts around the world

The table depicts data regarding various types of deserts across the globe, including Sahara desert, Takilmakan desert, and Great Basin desert. Overall, out of the three deserts Sahara shows the greatest outcome and experiences higher temperature extremes in contrast to the other two. While the Sahara and Great Basin show similar summer temperatures, however, Takilmakan […]

The table below shows the change in the percentages of people joining in seven different sports in an European country from 1999 to 2009. Summarise the information by selecting and reporting the main features, and make comparisons where relevant.

The table illustrates the change in the numbers of people taking part in seven variety of sports in one particular European country between 1999 to 2009. Overall, it is clear that there was an upward trend, excdeption of swimming, football, and basketball. It is also worth mationing that there was a slight fluctuation by the […]

The table shows the obesity rate in one country over a period of time.

The graph illustrates the percentage of those struggling with obesity in a country over nearly three decades. Overall, the trend remains positive, although some periods of stability were present in more recent years. It is noteworthy that younger people are less affected by such problem than older generations. The most drastic climb for all age […]

See All
We have detected unusual activity on your device.
Please verify your identity to continue.
Note: This verification step won't sign you in. If you have a premium account, please log in to access the service as usual.
Google/Gmail Verification
Or verify using Email/Code
We've sent a verification code to:
youremail@gmail.com (Not your email?)
Enter it below to complete the verification process.
Ensure your email address is correct, your inbox is not full, and you check your spam folder. If no email arrives, consider using an alternative email.
You will need a Premium plan to perform your action!
Note: If you already have a premium account, please log in to access our services as usual.

Plans & Pricing

Our mission is to make quality education accessible for everyone.
However, to keep our hardworking team running and this service alive, we genuinely need your support!
By opting for a premium plan, not only do you sustain us in achieving the mission, but you also unlock advanced features to enrich your learning experience.

Free

For learners who aren't pressed for time

What's included on Free
100+ Cambridge IELTS Tests
Instant IELTS Writing Task 1 & 2 Evaluation (2 times/month)
Instant IELTS Speaking Part 1, 2, & 3 Evaluation (5 times/month)
Instant IELTS Writing Task 1 & 2 Essay Generator (2 times/month)
500+ Dictation & Shadowing Exercises
100+ Pronunciation Exercises
Flashcards
Other Advanced Tools

Premium

For those serious about advancing their English proficiency, and for IELTS candidates aspiring to boost their band score by 1-2 points (especially in writing & speaking) in just 30 days or less

What's included on Premium
Save Your IELTS Test Progress
Unlock All Courses & IELTS Tests
Unlimited AI Conversations
Unlimited AI Writing Enhancement Exercises
Unlimited IELTS Writing Task 1 & 2 Evaluation
Unlimited IELTS Speaking Part 1, 2, & 3 Evaluation
Checked Answers Will Not Be Published
Unlimited IELTS Writing Task 1 & 2 Essay Generator
Unlimited IELTS Speaking Part 1, 2, & 3 Sample Generator
Unlimited Usage Of Advanced Tools
Priority Support within 24h (12-month plan only)

Due to the nature of our service and the provided free trials, payments are non-refundable.
Nếu bạn là người Việt Nam và không có hoặc không muốn trả bằng credit/debit cards, bạn có thể thanh toán bằng phương thức chuyển khoản:


Chọn gói:
419,000₫ 277,000 ₫ cho gói 1 tháng (chỉ 9,233₫/ngày)
1,239,000₫ 597,000 ₫ cho gói 3 tháng (chỉ 6,633₫/ngày)
2,469,000₫ 1,027,000 ₫ cho gói 6 tháng (chỉ 5,706₫/ngày)
4,929,000₫ 1,417,000 ₫ cho gói 12 tháng (chỉ 3,936₫/ngày)


Sau khi chuyển khoản, vui lòng đợi trình duyệt tự động điều hướng bạn trở lại Engnovate và bạn sẽ ngay lập tức nhận được mã kích hoạt tài khoản premium.
Nếu có lỗi xảy ra, bạn có thể liên hệ với team thông qua một trong các phương thức: email đến helloengnovate@gmail.com hoặc nhắn tin qua facebook.com/engnovate.
Vì toàn bộ công cụ trên website đều có thể sử dụng thử miễn phí, Engnovate không hỗ trợ hoàn tiền.