Our system will evaluate the answer based on this AI-generated description.
The image shows two tables comparing people's perceptions of various aspects of living conditions in 1980 and 2010. In 1980, the percentages for "good" are: education (72), healthcare (82), environment (72), shops (64), employment (62), and transport (52). The "neither good nor bad" percentages are: education (23), healthcare (20), environment (22), shops (22), employment (22), and transport (16). The "bad" percentages are: education (5), healthcare (8), environment (6), shops (10), employment (10), and transport (32). In 2010, the "good" percentages are: education (82), healthcare (74), environment (71), shops (60), employment (72), and transport (39). The "neither good nor bad" percentages are: education (11), healthcare (14), environment (13), shops (24), employment (5), and transport (23). The "bad" percentages are: education (9), healthcare (12), environment (16), shops (16), employment (23), and transport (38).
Given the complexity of the image, the above description may not be entirely accurate.
Skyrocket your IELTS band score by 1-2 points in under a month with our premium plan!
Note: Both the topic and the answer were created by one of our users.
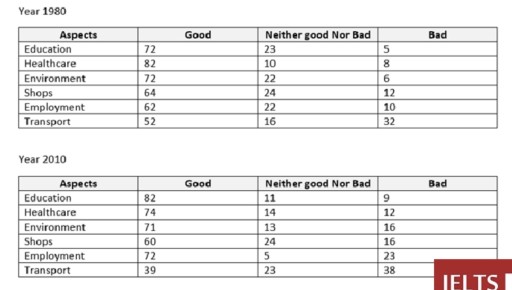
The two tables demonstrate results of 2 surveys about multiple aspects of urban life in various cities in two years (1980 and 2010). Overall, it is clear that in the first year healthcare aspect topped the list of good ones, whereas transport sector ranked first as a bad one. However, in 2010 education got by far the highest percentage in good column. Transport topped the list of bad units the second time. Other aspects in tables showed moderate fluctuations over the time period.
In 1980, it can be seen that healthcare aspect accounted for 82%, which was the highest among good units. Conversely, in bad units transport sector topped at 32%. Over the next two decades, transport’s percentage increased by 6%, standing at 38%, which still remained the highest in bad column. Meanwhile education aspect experienced a rise, exceeding healthcare by 8% and dominating the good units.
With regard to other aspects, it is evident that they were fluctuating over the years. Environment and shops’ percentages varied by 1-2% in column good, while employment and transport experienced moderate ups and downs.
Word Count: 181