🔥 Today Only: Save 30% on Premium — Offer Ends Soon! - Upgrade Now!
Table

Band 8+: The tables show results of 2 surveys done in 1980 and 2010 on various aspects of city living in a particular city. Units are measured in percentage.

Image for topic: The tables show results of 2 surveys done in 1980 and 2010 on various aspects of city living in a particular city. Units are measured in percentage.
Our system will evaluate the answer based on this AI-generated description.
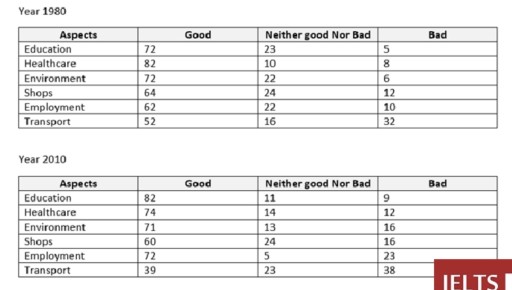
The image shows two tables comparing people's perceptions of various aspects of living conditions in 1980 and 2010. In 1980, the percentages for "good" are: education (72), healthcare (82), environment (72), shops (64), employment (62), and transport (52). The "neither good nor bad" percentages are: education (23), healthcare (20), environment (22), shops (22), employment (22), and transport (16). The "bad" percentages are: education (5), healthcare (8), environment (6), shops (10), employment (10), and transport (32). In 2010, the "good" percentages are: education (82), healthcare (74), environment (71), shops (60), employment (72), and transport (39). The "neither good nor bad" percentages are: education (11), healthcare (14), environment (13), shops (24), employment (5), and transport (23). The "bad" percentages are: education (9), healthcare (12), environment (16), shops (16), employment (23), and transport (38).
Given the complexity of the image, the above description may not be entirely accurate.
Note: Both the topic and the answer were created by one of our users.

The table presents data from two surveys conducted in 1980 and 2010 on six aspects of city living in a particular city.

Overall, it can be clearly seen that the proportion of people who chose the “bad” section experienced an increase in 2010 across all aspects. Similarly, the proportion of citizens who chose the “Neither good Nor Bad” section saw a decrease, except for shops and transport.

Healthcare recorded the highest proportion of people who chose “Good,” accounting for 82% in 1980, while education had the second-largest proportion at 72% in 1980. However, education replaced healthcare in 2010, comprising 82%, whereas healthcare witnessed a decline of 8 percentage points in 2010. In addition, the environment remained almost stagnant for this section at 72% and 71% in both years.

Similar evidence is seen in shops, which did not see a change in the “Neither good Nor Bad” section, accounting for 24% in both years. Additionally, employment experienced a dramatic decrease from 22% in 1980 to 5% in 2010 in the “Neither good Nor Bad” section. Therefore, only transport recorded the highest increase of 7 percentage points in 2010 in comparison to the others.

Word Count: 192

Answers On The Same Topic:

The tables show results of 2 surveys done in 1980 and 2010 on various aspects of city living in a particular city. Units are measured in percentage.

Two given tables illustrate the results from two researches in two years, 1980 and 2010. The researches were about ranking on four living categories in a city, which are education, healthcare, environment and transport. rankings are categorized as good, neither good nor bad and bad. At first glance, the major ranking of all four aspects […]

The tables show results of 2 surveys done in 1980 and 2010 on various aspects of city living in a particular city. Units are measured in percentage.

The tables provide informations of 2 surveys finished in 1980 and 2010 on diverse categories by city living in a particular city, and units are count as well as percentage. Overall the categories are decrease on good riviews and only 2 aspect are increased on good riviews while all the bad riviews are rising. The […]

The tables show results of 2 surveys done in 1980 and 2010 on various aspects of city living in a particular city. Units are measured in percentage.

The two tables demonstrate results of 2 surveys about multiple aspects of urban life in various cities in two years (1980 and 2010). Overall, it is clear that in the first year healthcare aspect topped the list of good ones, whereas transport sector ranked first as a bad one. However, in 2010 education got by […]

The tables show results of 2 surveys done in 1980 and 2010 on various aspects of city living in a particular city. Units are measured in percentage.

The table illustrates the results of two surveys conducted in 1980 and 2010 in a city to assess six different aspects of city life. The response was recorded in terms of the percentage of people. Overall, education, healthcare, and the environment received the highest score in both years, whereas transport was rated the lowest. Meanwhile, […]

See All

Other Topics:

Write a report for the given table. The table shows the number of exchange students from universities in Europe to Australia and vice versa.

Both tables delineate the enumeration of exchange students initially from Europe to Australia and vice versa. Overall, more scholars were transferred to Australia in 2009 than in 2007; by contrast, scholars’ destination in Europe remain unchanged. The first table delineating exchange students to Australia reveals that, in 2007, France has the most scholars transferred at […]

The table below shows the percentage participation of women in senior management in three companies between 1975 and 2015. Summarise the information by selecting and reporting the main features, and make comparisons where relevant.

The table provides information regarding the percentages of women who participated in senior management positions in three distinct companies from 1975 to 2015. Overall, it is evident that all of the three examined firms underwent an upward trend throughout the period. Noticeably, while the level for Finsbury Ltd showed stronger performance initially, those for remaining […]

The table below gives information about a bakery's average sales in three different branches in 2015. Summarise the information by selecting and reporting the main features, and make comparisons where relevant. You should write at least 150 words.

The table illustrates the avarage sales of a bakery across three different branches in 2015. Overall, London Covent Garden recorded the highest number of transactions and the highest transaction value, while London St John’s Wood had the lowest number of transactions. In addition, take-away transactions were higher than eat-in transactions in Covent Garden and Oxford […]

the table below show the responses of people from different age groups regarding how they feel about two different aspects of the library.

The two tables illustrate the opinions of three different age groups regarding the range of books and the quality of non-print materials available in a library. Overall, younger people were more positive about the range of books, whereas the two older groups were more likely to consider it satisfactory. Regarding non-print materials, the 15-39 age […]

The table shows the percentage of household with electronic goods in New Zealand in 1997 and 2002.Summarise the information by selecting and reporting the main features and make comparisons where relevant.

The given table illustrates information about the proportion of household with electronic items in New Zealand, presenting data for six different categories across 1997 and 2002 Overall, it is evident that television was increased in almost every house in New Zealand, whereas Washing Machine showed no change during the period. Looking at the details, Personal […]

The table shows the export values of various products in 2009 and 2010.

The given table indicates the export values of five product categories between 1997 and 2010. Overall, it is obvious that the export values experienced an upward trend in most categories, while the figures for clothing and manufacturing exhibited a reverse pattern. In addition, equipment and telecommunication constituted the highest revenues throughout the surveyed period. Equipment […]

See All
We have detected unusual activity on your device.
Please verify your identity to continue.
Note: This verification step won't sign you in. If you have a premium account, please log in to access the service as usual.
Google/Gmail Verification
Or verify using Email/Code
We've sent a verification code to:
youremail@gmail.com (Not your email?)
Enter it below to complete the verification process.
Ensure your email address is correct, your inbox is not full, and you check your spam folder. If no email arrives, consider using an alternative email.
You will need a Premium plan to perform your action!
Note: If you already have a premium account, please log in to access our services as usual.

Plans & Pricing

Our mission is to make quality education accessible for everyone.
However, to keep our hardworking team running and this service alive, we genuinely need your support!
By opting for a premium plan, not only do you sustain us in achieving the mission, but you also unlock advanced features to enrich your learning experience.

Free

For learners who aren't pressed for time

What's included on Free
100+ Cambridge IELTS Tests
Instant IELTS Writing Task 1 & 2 Evaluation (2 times/month)
Instant IELTS Speaking Part 1, 2, & 3 Evaluation (2 times/month)
Instant IELTS Writing Task 1 & 2 Essay Generator (2 times/month)
500+ Dictation & Shadowing Exercises
100+ Pronunciation Exercises
Flashcards
Other Advanced Tools

Premium

For those serious about advancing their English proficiency, and for IELTS candidates aspiring to boost their band score by 1-2 points (especially in writing & speaking) in just 30 days or less

What's included on Premium
Save Your IELTS Test Progress & Analyze Mistakes By Question Type
Save Your Own Flashcard Sets & Use Them On Any Device
Unlock All Courses, IELTS Tests, Section & Part Practice
Unlimited AI Conversations
Unlimited AI Writing Enhancement Exercises
Unlimited IELTS Writing Task 1 & 2 Evaluation
Unlimited IELTS Speaking Part 1, 2, & 3 Evaluation
Checked Answers Will Not Be Published
Unlimited IELTS Writing Task 1 & 2 Essay Generator
Unlimited IELTS Speaking Part 1, 2, & 3 Sample Generator
Unlimited Usage Of Advanced Tools & AI Features
Priority Support within 24h (12-month plan only)

Due to the nature of our service and the provided free trials, payments are non-refundable.