Our system will evaluate the answer based on this AI-generated description.
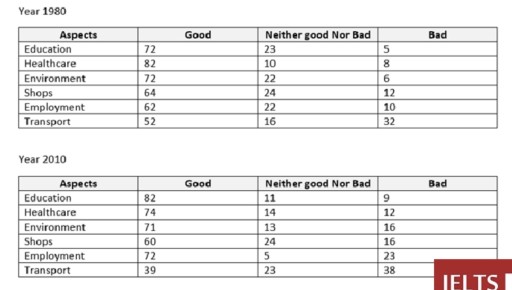
The image shows two tables comparing people's perceptions of various aspects of living conditions in 1980 and 2010. In 1980, the percentages for "good" are: education (72), healthcare (82), environment (72), shops (64), employment (62), and transport (52). The "neither good nor bad" percentages are: education (23), healthcare (20), environment (22), shops (22), employment (22), and transport (16). The "bad" percentages are: education (5), healthcare (8), environment (6), shops (10), employment (10), and transport (32). In 2010, the "good" percentages are: education (82), healthcare (74), environment (71), shops (60), employment (72), and transport (39). The "neither good nor bad" percentages are: education (11), healthcare (14), environment (13), shops (24), employment (5), and transport (23). The "bad" percentages are: education (9), healthcare (12), environment (16), shops (16), employment (23), and transport (38).
Given the complexity of the image, the above description may not be entirely accurate.
Skyrocket your IELTS band score by 1-2 points in under a month with our premium plan!
Note: Both the topic and the answer were created by one of our users.
The tables provide informations of 2 surveys finished in 1980 and 2010 on diverse categories by city living in a particular city, and units are count as well as percentage. Overall the categories are decrease on good riviews and only 2 aspect are increased on good riviews while all the bad riviews are rising.
The education categories is the highest rising aspects on the good riview sides,in addition Start on 72 percents in 1980 and finished on 82 percents in 2010 followed by the Employment with the same figure as well as education that sharply increase by 10 percents from 1980 on 62 percents and end on 72 percents in 2010.While The other 4 categories on good riviews are declined with tarnsports as the sharpest decline by 13 percents
However on the bad riviews all of the categories are increase with healhcare, education , and shops had the same amount of rise that is by 4 percents increase and followed by transport and environtment gradually increase by 6 and 10 percents respectively.Furthermore Employment is the highest increase figure that is 13 percents from 1980 with 10 percents and finished in 2010 with 23 percents
Word Count: 194
