Our system will evaluate the answer based on this AI-generated description.
The image contains two charts: Chart (a) displays urban traffic speed (in kph) for France: 48 (1970), 55 (1990), 52 (2010), 72 (2020est); USA: 32 (1970), 48 (1990), 43 (2010 and 2020est); Italy: 52 (1970), 52 (1990), 54 (2010), 65 (2020est); Brazil: 54 (1970), 54 (1990), 56 (2010), 67 (2020est); UK: 53 (1970), 53 (1990), 62 (2010), 79 (2020est); Russia: 61 (1970), 63 (1990), 61 (2010), 64 (2020est); Spain: 69 (1970), 51 (1990), 65 (2010), 70 (2020est); Canada: 51 (1970), 59 (1990), 63 (2010), 71 (2020est); Chile: 51 (1970), 52 (1990), 53 (2010), 52 (2020est); Chart (b) shows urban zones (in thousands) for France: 2.8 (1970), 9.3 (2020est); USA: 38 (1970), 128.2 (2020est); Italy: 1.1 (1970), 15.1 (2020est); Brazil: 3.4 (1970), 12.4 (2020est); UK: 6.4 (1970), 11.8 (2020est); Russia: 6.7 (1970), 3.2 (2020est); Spain: 2.6 (1970), 8.5 (2020est); Canada: 9.9 (1970), 9.9 (2020est); Chile: 1.1 (1970), 5.4 (2020est).
Given the complexity of the image, the above description may not be entirely accurate.
Skyrocket your IELTS band score by 1-2 points in under a month with our premium plan!
Note: Both the topic and the answer were created by one of our users.
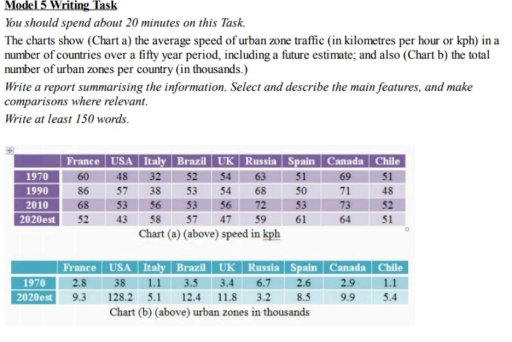
The first table illustrates the average speed in urban zones in 9 countries from 1970 to 2020 in kilometres per hour. The second table demostrates the size of urban zones in thousands in the same countries. Overall, in almost all countries the average speed is decreasing slightly for 50 years. Also the count of urban zones increasing almost everywhere.
The biggest average speed growth for 50 years was in Italy – 26 kph. Also slight growth was in Brazil – for 5 kilometres per hour, and in Spain – from 51 kph in 1970 to 61 in 2020. The biggest average speed decrease was in France – for 8 kilometres per hour. The stable fall was in USA – 5 kph, UK – 7 kph, Russia – 4 kph and Canada – 5 kph. And in Chile, the average speed didn’t change. Despite for increase or decrease of average speed, the size of urban zones climbed almost everywhere, except – Russia. The count of urban zones in Russia felt from 6.7 to 3.2 thousands. The sharpest growth was in USA – it is about 90 thousands. In other countries was slight rise of urban zones – about 7 thousands.
In general, average speed rose steady almost everywhere. Also considerable growth of urban zones was in all countries, except Russia.
Word Count: 219