🔥 Today Only: Save 30% on Premium — Offer Ends Soon! - Upgrade Now!
Bar Chart

Band 9: You should spend about 20 minutes on this task. Writing Task 1 The graph shows the percentage of male and female academic staff members across the faculties of a major university in 2012. Summarise the information by selecting and reporting the main features, and make comparisons where relevant.

Image for topic: You should spend about 20 minutes on this task. Writing Task 1 The graph shows the percentage of male and female academic staff members across the faculties of a major university in 2012. Summarise the information by selecting and reporting the main features, and make comparisons where relevant.
Our system will evaluate the answer based on this AI-generated description.
The image presents a bar chart titled "Academic staff percentages in faculties, by gender, 2012", displaying percent composition of male and female academic staff across various faculties. For the Arts faculty, female staff make roughly 40% while male staff comprise about 60%. In the Business faculty, the percentages are approximately female 35% and male 65%. The Education faculty shows a higher female representation at about 70%, with males constituting about 30%. Engineering shows a contrasting distribution, with females at around 15% and males dominating at approximately 85%. For Law, the distribution is nearly balanced, with females at about 45% and males at 55%. The Medical faculty portrays females at approximately 45% and males at 55%. Lastly, the Science faculty has about 40% females and 60% males. Each faculty's data is divided into two distinct bars representing each gender, aligned on a vertical axis ranging from 0 to 100%.
Given the complexity of the image, the above description may not be entirely accurate.
Note: Both the topic and the answer were created by one of our users.

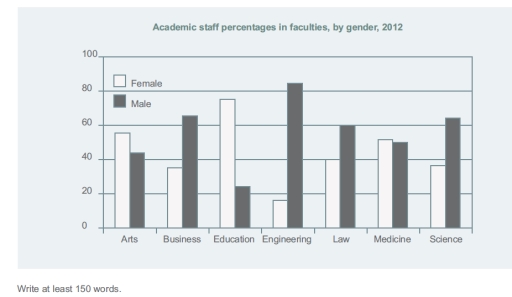
The bar chart illustrates the proportions of male and female academic staff in seven faculties of a large university in 2012.

Overall, men dominated the teaching staff in most disciplines, particularly in Engineering and Science, while women prevailed in Education and Arts. Other faculties, such as Law, Medicine, and Business, displayed a more balanced distribution between the genders.

Engineering stood out as the most male-dominated faculty, with more than 80% of its staff being men, whereas women accounted for fewer than one in five. Science exhibited a similar but less pronounced trend, with roughly 65% male and 35% female representation. In contrast, Education was the reverse: nearly three-quarters of the faculty were women, leaving only about 20% of positions occupied by men.

A moderate female advantage was also evident in Arts, where women constituted just over half of the staff. By comparison, Business showed the opposite tendency, with male lecturers outnumbering their female counterparts by roughly 10 percentage points. Law and Medicine, meanwhile, recorded near parity, with each gender making up close to half of the academic workforce.

Word Count: 178

Answers On The Same Topic:

You should spend about 20 minutes on this task. Writing Task 1 The graph shows the percentage of male and female academic staff members across the faculties of a major university in 2012. Summarise the information by selecting and reporting the main features, and make comparisons where relevant.

The bar chart illustrates the number of female and male academic stuff members across the faculties of a major institution in 2012. Overall, the percentage rages across different disciplines, with females prevailing in arts and education and males taking over business and engineering fields. As for women, the highest percentage is reported in education and […]

You should spend about 20 minutes on this task. Writing Task 1 The graph shows the percentage of male and female academic staff members across the faculties of a major university in 2012. Summarise the information by selecting and reporting the main features, and make comparisons where relevant.

The given bar graph provides information about the percentage of academic staff by their gender in different faculties of a major university in 2012. Overall, the engineering, buisness, science and law departments held the highest percentage of male staff. While, female staff was more prevailent in eductaion, and art departments. However, the medicine department showed […]

You should spend about 20 minutes on this task. Writing Task 1 The graph shows the percentage of male and female academic staff members across the faculties of a major university in 2012. Summarise the information by selecting and reporting the main features, and make comparisons where relevant.

The bar chart illustrates the proportions of academic staff members between men and women across the academic faculties of a major university in 2012. Overall, it is evident that the proportion of male staff members higher than female staff members in business, engineering, law, and science facilities. In contrast, the proportion of male staff members […]

You should spend about 20 minutes on this task. Writing Task 1 The graph shows the percentage of male and female academic staff members across the faculties of a major university in 2012. Summarise the information by selecting and reporting the main features, and make comparisons where relevant.

The graph illustrates the proportion of male and female academic staff members associated with different faculties of a main university during 2012. Overall, male were maximum involved in engineering, whereas female participation seemed larger in education faculty. However, there was almost same ratio of male and female in medicine. In 2012, male participation dominated female […]

See All

Other Topics:

The graphs below show the average retirement age for men and women in 2004 and 2008 in six different countries

The provided bar charts offer us a comparative view of average retirement age patterns regarding different genders in 2004 and 2008 across six different countries, including Denmark, France, Italy, the Netherlands, Sweden, and the UK. Overall, the average retirement age for both males and females witnessed a modest rise from 2004 to 2008, while the […]

The chart below shows the number of insurance policies issued by insurance companies in Nepal from 2015 to 2019. Summarize the information by selecting and reporting the main features, and make comparisons where relevant.

The given bar graph compares the number of insurance policies issued by insurance companies in terms of life and Non-life insurance in between 2015 and 2019 in Nepal. Overall, there is a noticeable increase in the number of policies over the years. Moreover, life insurance had the highest figure while the non-life was the lowest. […]

The chart below shows the main reasons why agricultural land becomes less productive in three regions of the world. Summarise the information by selecting and reporting the main features, and make comparisons where relevant.

The bar chart illustrates the key causes of the reduced productivity in three areas of the world namely, North America, Europe, and Oceania. Overall, Europe is significantly affected by all for reasons, including over-grazing, deforestration, over-cultivation, and other. In contrast, Ocenia remained non-affected by over-cultivation. Notably, the percentages of degraded land in both North Amarica […]

The bar chart below shows how exports from one country were transported in three different years. Summarise the information by selecting and reporting the main features, and make comparisons where relevant.

The bar graph illustrates the proportion of total exports transported by sea, air, and road in a single country over the period from 2010 to 2012. Overall, sea transport was by far the dominant method throughout the period and its share increased steadily, while air transport declined consistently. Road transport fluctuated slightly, overtaking air as […]

The graph shows Internet usage at one of the Russian universities from August to November 2021. Summarize the information by selecting and reporting the main features and make comparisons where relevant.

The bar chart illustrate internet usage at one of the Russian universities between August to November 2021. In August, students was used internet on campus at about 20%. The number of guests had between approximately 20% and 80% usage internet respectevely. In 2021, teachers had 20% of usage on campus universities. The number of students […]

The chart below shows the main reasons for deforestation in three different regions of the world during two separate decades. Summarise the information by selecting and reporting the main features and make comparisons where relevant.

The bar chart gives information about the percentage of five different reasons of deforestaion in south America, Southeast Asia, and Central Africa in the decades 1990-2000, and 2010-2020. Overall, it is clear that every region had different ratio, and the highst reason was completalty different. The main reason for deforestaion in South America was the […]

See All
We have detected unusual activity on your device.
Please verify your identity to continue.
Note: This verification step won't sign you in. If you have a premium account, please log in to access the service as usual.
Google/Gmail Verification
Or verify using Email/Code
We've sent a verification code to:
youremail@gmail.com (Not your email?)
Enter it below to complete the verification process.
Ensure your email address is correct, your inbox is not full, and you check your spam folder. If no email arrives, consider using an alternative email.
You will need a Premium plan to perform your action!
Note: If you already have a premium account, please log in to access our services as usual.

Plans & Pricing

Our mission is to make quality education accessible for everyone.
However, to keep our hardworking team running and this service alive, we genuinely need your support!
By opting for a premium plan, not only do you sustain us in achieving the mission, but you also unlock advanced features to enrich your learning experience.

Free

For learners who aren't pressed for time

What's included on Free
100+ Cambridge IELTS Tests
Instant IELTS Writing Task 1 & 2 Evaluation (2 times/month)
Instant IELTS Speaking Part 1, 2, & 3 Evaluation (2 times/month)
Instant IELTS Writing Task 1 & 2 Essay Generator (2 times/month)
500+ Dictation & Shadowing Exercises
100+ Pronunciation Exercises
Flashcards
Other Advanced Tools

Premium

For those serious about advancing their English proficiency, and for IELTS candidates aspiring to boost their band score by 1-2 points (especially in writing & speaking) in just 30 days or less

What's included on Premium
Save Your IELTS Test Progress & Analyze Mistakes By Question Type
Save Your Own Flashcard Sets & Use Them On Any Device
Unlock All Courses, IELTS Tests, Section & Part Practice
Unlimited AI Conversations
Unlimited AI Writing Enhancement Exercises
Unlimited IELTS Writing Task 1 & 2 Evaluation
Unlimited IELTS Speaking Part 1, 2, & 3 Evaluation
Checked Answers Will Not Be Published
Unlimited IELTS Writing Task 1 & 2 Essay Generator
Unlimited IELTS Speaking Part 1, 2, & 3 Sample Generator
Unlimited Usage Of Advanced Tools & AI Features
Priority Support within 24h (12-month plan only)

Due to the nature of our service and the provided free trials, payments are non-refundable.
Nếu bạn là người Việt Nam và không có hoặc không muốn trả bằng credit/debit cards, bạn có thể thanh toán bằng phương thức chuyển khoản:


Chọn gói:
419,000₫ 277,000 ₫ cho gói 1 tháng (chỉ 9,233₫/ngày)
1,239,000₫ 597,000 ₫ cho gói 3 tháng (chỉ 6,633₫/ngày)
2,469,000₫ 1,027,000 ₫ cho gói 6 tháng (chỉ 5,706₫/ngày)
4,929,000₫ 1,417,000 ₫ cho gói 12 tháng (chỉ 3,936₫/ngày)


Sau khi chuyển khoản, vui lòng đợi trình duyệt tự động điều hướng bạn trở lại Engnovate và bạn sẽ ngay lập tức nhận được mã kích hoạt tài khoản premium.
Nếu có lỗi xảy ra, bạn có thể liên hệ với team thông qua một trong các phương thức: email đến helloengnovate@gmail.com hoặc nhắn tin qua facebook.com/engnovate.
Vì toàn bộ công cụ trên website đều có thể sử dụng thử miễn phí, Engnovate không hỗ trợ hoàn tiền.