24 Hours Only: Get 39% OFF on Our Premium Plan - Check Out Now!
Process Diagram

Band 6+: The diagram shows differences in temperature zones between tropical mountains and temperate mountains. Summarise the information by selecting and reporting the main features, and make comparisons where relevant.

Image for topic: The diagram shows differences in temperature zones between tropical mountains and temperate mountains. Summarise the information by selecting and reporting the main features, and make comparisons where relevant.
Our system will evaluate the answer based on this AI-generated description.
The image depicts two triangular diagrams representing tropical and temperate mountain altitudes, divided into various ecological zones. Tropical mountain altitude ranges from 0 to 5,500 meters (18,000 feet). Warm zone is 0-1,000 meters (0-3,300 feet) for tropical crops. Temperate zone is 1,000-2,000 meters (3,300-6,600 feet) for coffee and cocos. Cool zone is 2,000-3,000 meters (6,600-10,000 feet) for grain cultivation. Forest begins at 3,000 meters (10,000 feet), with a limit for broad-leaf trees at 3,500 meters (11,500 feet) and pine and firs limit at 4,000 meters (13,000 feet). Alpine meadows start at 4,000 meters (13,000 feet), snow line is at 5,000 meters (16,500 feet), and permanent snow begins at 5,500 meters (18,000 feet). Temperate mountain altitude ranges from 0 to 3,500 meters (12,000 feet). Warm zone is 0-500 meters (0-1,500 feet), Temperate zone is 500-1,000 meters (1,500-3,000 feet), Cool zone is 1,000-1,500 meters (3,000-5,000 feet) for grains, potatoes, flax. Forest begins at 1,500 meters (5,000 feet), with a limit for broad-leaf trees at 2,000 meters (6,500 feet) and spruce limit at 2,500 meters (8,500 feet). Alpine meadows start at 2,500 meters (8,500 feet), snow line is at 3,000 meters (10,000 feet), and permanent snow begins at 3,500 meters (12,000 feet).
Given the complexity of the image, the above description may not be entirely accurate.
Note: Both the topic and the answer were created by one of our users.

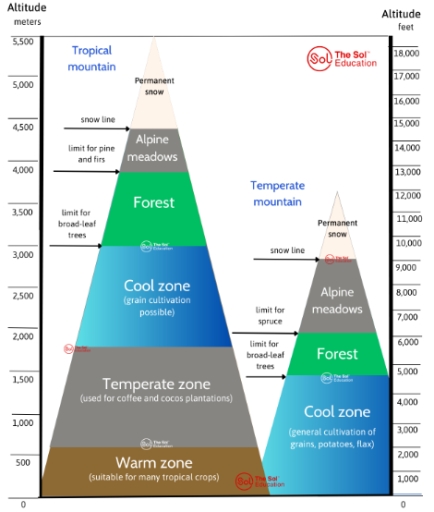
The diagram compares the differences in terms of tropical and temperate mountains according to their altitude.

It is clear that tropical and temperate mountains have some similar features with permanent snow at the highest region and cultivated areas at lower levels. However, the former includes two additional areas, namely Temperature zone and warm zone, whereas the later does not. In addition, the cultivation of crops and trees also show the disparity significantly between the two mountain types.

From the top, permanent snow ranges from 4,400 to 5,500 meters on the tropical mountain and from 2,800 to 3,700 meters on temperate mountain. In both mountains, forested areas and alpine meadows are located above the agricultural areas; they begin at 3,000 meters for tropical mountain and half of that height for temperate one.

Look at the fourth zone of the two mountains, while the cool zone of the tropical mountain is shown between 3,000 and 1,800 meters and used for grain cultivation, that of the temperate counterpart is presented from the sea level to 4,800 meters and for planting grain, potatoes and flax. In tropical mountain, between 1,800 meters and below are temperate and warm zones, which are farmed to grow coffee with cocos and many tropical crops respectively.

Word Count: 207

Answers On The Same Topic:

The diagram shows differences in temperature zones between tropical mountains and temperate mountains. Summarise the information by selecting and reporting the main features, and make comparisons where relevant.

The diagram illustrates the variations between the features of tropical mountains and temperate mountains in different altitudes. Overall, while both temperate mountains and tropical mountains are divided into four different sections, they have different sizes of each layer. Notably, while tropical mountains have a larger area for most part than temperate mountains, the only exception […]

The diagram shows differences in temperature zones between tropical mountains and temperate mountains. Summarise the information by selecting and reporting the main features, and make comparisons where relevant.

The diagram illustrates the variations between the features of tropical mountains and temperate mountains in different altitudes. Overall, while both temperate mountains and tropical mountains are divided into four different parts, they have different sizes of each layer. Notably, while tropical mountains have a larger area for most part than temperate mountains, the only exception […]

The diagram shows differences in temperature zones between tropical mountains and temperate mountains. Summarise the information by selecting and reporting the main features, and make comparisons where relevant.

The diagram shows differences in temperature zones in tropical and temperate mountains. Overall, while four climatic zones from the top downwards of both regions are similar, tropical mountains feature a wider range of regions, because they are higher. Temperate mountains have a less complex structure than tropical mountains. From sea level to approximately 1,500 meters, […]

The diagram shows differences in temperature zones between tropical mountains and temperate mountains. Summarise the information by selecting and reporting the main features, and make comparisons where relevant.

The graph compares the tropical mountain and the temperate mountain in terms of height and the zones involved in the two types of mountain. Overall, the tropical mountain is considerably higher than its temperate counterpart, and also contains more diverse zones with a variety of vegetation. As can be seen from the graph, the temperate […]

The diagram shows differences in temperature zones between tropical mountains and temperate mountains. Summarise the information by selecting and reporting the main features, and make comparisons where relevant.

The diagram compares the variation in temperature zones at different altitudes on tropical and temperate mountains. Overall, both types of mountains show a similar progression of temperature zones from warm at the base to permanent snow at the summit, but they differ in the altitude ranges in the vegetation supported at each level. In tropical […]

See All

Other Topics:

The diagram gives information about the process of liquid chocolate production.

The diagram illustrates the whole process of liquid chocolate production. Overall, process has 10 steps starting from getting cocoa beans from trees and ending with producing liquid chocolate. The process starts with finding cocoa tree that grow in countries like America,Africa, Indonesia. Then pods are harvested and white cocoa beans are obtained. Following that, these […]

The diagram below describes the structure of a home smokery and how it works. Summarise the information by selecting and reporting the main features and make comparisons where relevant.

The diagram presents the system of a home smokery and how it works. Overall, it can be seen that the air has the main role in the process of creating a home smokery. The process starts with the displacement of air. During the first step air leave under the lid and go through. Then the […]

The diagram shows a method of shaping glass containers. Summarize the information by selecting and reporting the main features, and make comparisons where relevant.

The image illustrates the process of shaping glass containers. Overall, the process consists of several stages, beginning with heating raw glass and ending with quality control, in which the containers could either be packaged or sent away as waste. First, raw glass is placed in a furnace and heated at 105 degree celcius. Then, the […]

The diagram below shows the process of how pu'erh tea is made. Summarise the information by selecting and reporting the main features, and make comparisons where relevant.

The given process depicts the way how to treat tea products. Overall, there are five stages for each kind of tea produced, beginning with frying tea leaves and ending with two types of tea, Pu-erh Riep Tea and Vintage Pu-erh Raw Tea. At the first stage, the tea leaves are dried by the pan. After […]

The diagram shows the process for labelling shellfish for the international market. summarize the information by selecting and reporting the main features.

The images gives information about the techniques used for labelling Shellfish before global exportation. It systematically shows the process involved starting with traditional fishing down to when the certified shellfish gets to both local and international consumers hand. Overall, the methods involed from the artisans fishing to labelling systems was majorly monitoring techniques while the […]

See All
We have detected unusual activity on your device.
Please verify your identity to continue.
Note: This verification step won't sign you in. If you have a premium account, please log in to access the service as usual.
Google/Gmail Verification
Or verify using Email/Code
We've sent a verification code to:
youremail@gmail.com (Not your email?)
Enter it below to complete the verification process.
Ensure your email address is correct, your inbox is not full, and you check your spam folder. If no email arrives, consider using an alternative email.
You will need a Premium plan to perform your action!
Note: If you already have a premium account, please log in to access our services as usual.

Plans & Pricing

Our mission is to make quality education accessible for everyone.
However, to keep our hardworking team running and this service alive, we genuinely need your support!
By opting for a premium plan, not only do you sustain us in achieving the mission, but you also unlock advanced features to enrich your learning experience.

Free

For learners who aren't pressed for time

What's included on Free
100+ Cambridge IELTS Tests
Instant IELTS Writing Task 1 & 2 Evaluation (2 times/month)
Instant IELTS Speaking Part 1, 2, & 3 Evaluation (5 times/month)
Instant IELTS Writing Task 1 & 2 Essay Generator (2 times/month)
500+ Dictation & Shadowing Exercises
100+ Pronunciation Exercises
Flashcards
Other Advanced Tools

Premium

For those serious about advancing their English proficiency, and for IELTS candidates aspiring to boost their band score by 1-2 points (especially in writing & speaking) in just 30 days or less

What's included on Premium
Save Your IELTS Test Progress
Unlock All Courses & IELTS Tests
Unlimited AI Conversations
Unlimited AI Writing Enhancement Exercises
Unlimited IELTS Writing Task 1 & 2 Evaluation
Unlimited IELTS Speaking Part 1, 2, & 3 Evaluation
Checked Answers Will Not Be Published
Unlimited IELTS Writing Task 1 & 2 Essay Generator
Unlimited IELTS Speaking Part 1, 2, & 3 Sample Generator
Unlimited Usage Of Advanced Tools

Due to the nature of our service and the provided free trials, payments are non-refundable.
Nếu bạn là người Việt Nam và không có hoặc không muốn trả bằng credit/debit cards, bạn có thể thanh toán bằng phương thức chuyển khoản:


Chọn gói:
279,000₫ 157,000 ₫ cho gói 1 tháng (chỉ 5,233₫/ngày)
819,000₫ 397,000 ₫ cho gói 3 tháng (chỉ 4,411₫/ngày)
1,649,000₫ 667,000 ₫ cho gói 6 tháng (chỉ 3,706₫/ngày)
3,299,000₫ 857,000 ₫ cho gói 12 tháng (chỉ 2,381₫/ngày)


Sau khi chuyển khoản, vui lòng đợi trình duyệt tự động điều hướng bạn trở lại Engnovate và bạn sẽ ngay lập tức nhận được mã kích hoạt tài khoản premium.
Nếu có lỗi xảy ra, bạn có thể liên hệ với team thông qua một trong các phương thức: email đến helloengnovate@gmail.com hoặc nhắn tin qua facebook.com/engnovate.
Vì toàn bộ công cụ trên website đều có thể sử dụng thử miễn phí, Engnovate không hỗ trợ hoàn tiền.