🔥 Today Only: Save 30% on Premium — Offer Ends Soon! - Upgrade Now!
Table

Band 5+: The table below shows the consumer durables (telephone, refrigerator, etc. owned in Britain from 1972 to 1983

Image for topic: The table below shows the consumer durables (telephone, refrigerator, etc. owned in Britain from 1972 to 1983
Our system will evaluate the answer based on this AI-generated description.
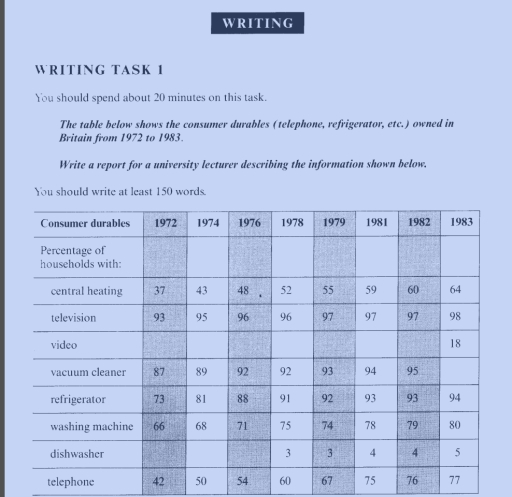
The image contains a table detailing the percentage of British households owning specific consumer durables from 1972 to 1983. Central heating ownership: 37% in 1972, 43% in 1974, 48% in 1976, 52% in 1978, 55% in 1979, 59% in 1981, 60% in 1982, 64% in 1983. Television ownership: 93% in 1972, 95% in 1974, 96% in 1976, 96% in 1978, 97% in 1979, 97% in 1981, 97% in 1982, 98% in 1983. Video ownership starts at 18% in 1983. Vacuum cleaner ownership: 87% in 1972, 89% in 1974, 92% in 1976, 92% in 1978, 93% in 1979, 94% in 1981, 95% in 1982 and 1983. Refrigerator ownership: 73% in 1972, 81% in 1974, 85% in 1976, 91% in 1978, 92% in 1979, 93% in 1981, and 94% in 1982 and 1983. Washing machine ownership: 66% in 1972, 68% in 1974, 71% in 1976, 75% in 1978, 74% in 1979, 78% in 1981, 79% in 1982, 80% in 1983. Dishwasher ownership: 3% in 1978, 3% in 1979 and 1981, 4% in 1982, 5% in 1983. Telephone ownership: 42% in 1972, 50% in 1974, 54% in 1976, 60% in 1978, 67% in 1979, 75% in 1981, 76% in 1982, 77% in 1983.
Given the complexity of the image, the above description may not be entirely accurate.
Note: Both the topic and the answer were created by one of our users.

The provided table outlines the number of house equipment which were used by their customers in Britain between 1972 and 1983.

Overall, it is evident that, the household application that saw higher usage were televisions, vacuum cleaner and, refrigerator, whereas videos and dishwashers were utilized the less frequently.

Turning to the specific data, telephone usage exhibit steady increase from 1972 to 1983 with the number of application was 42, 50, 54, 60, 67, 75, 76, 77, respectively. In addition.The ownership rates of central heating, television, refrigerator and washing machine exhibited similar trends, with a gain from 37% to 64% , 93% to 98% ,73% to 64% ,66% to 80%, progressively.

According to the table, the percentage of vacuum cleaner was 87, 89, 92, 92, 93, 94, 95 between 1972 to 1982. In 1983, only 18% Of consumers purchased the videos wherever the proportion of dishwasher owner remained relatively stable fluctuation between 3% and 5% over the last five years.

Word Count: 159

Answers On The Same Topic:

The table below shows the consumer durables (telephone, refrigerator, etc. owned in Britain from 1972 to 1983

The provided table chart illustrates the data of household things that individuals owned in Britain from 1972 to 1983. Overall, it is evident that the most preferred item was television, while the least was video and dishwasher, in contrast to other things in which data was slightly rose. Turning to details, the count for central […]

The table below shows the consumer durables (telephone, refrigerator, etc. owned in Britain from 1972 to 1983

The provided table elucidate the consumer durable owning in United Kingdom between the years of 1972 to 1983. As an overall, it is noticeable here that deviation can be seen throughout the period. To commence, in the start four years of the given period fluctuation can be detected in the percentage of all households. However, […]

The table below shows the consumer durables (telephone, refrigerator, etc. owned in Britain from 1972 to 1983

The table illustrates the ownership of consumer durables such as central heating, television, video, etc. in Britain from 1972 to 1983. Overall, the ownership of consumer durables increased during this period. The biggest increases between the two years were in telephone and refrigerator ownership. Television was the most common in all the years. In 1972, […]

The table below shows the consumer durables (telephone, refrigerator, etc. owned in Britain from 1972 to 1983

The table chart compares the number of consumer durables ( Central heating, Television, Video, Vacuum cleaner, Refrigerator, Washing machine, Dishwasher, and Telephone) owned in Britain between 1972 to 19863. Overall, it is clear that Television number for the largest share of the Britain over the period, while Dishwasher accounted for the smallest share. Other categories […]

The table below shows the consumer durables (telephone, refrigerator, etc. owned in Britain from 1972 to 1983

The graph illustrates the percentage of households that owned various consumer durables from 1972 to 1983 in Britain. Overall, all the consumer durables increased steadily, although the extent of growth varied considerably. Televisions and vacuum cleaners were already widely owned by households in 1972, while central heating experienced the most substantial rise. By 1983, televisions, […]

See All

Other Topics:

The table below shows the percentage of patients saying the service was very good.

The table illustrates the proportion of clients who had satisfaction with four aspects of three hospitals. Overall, it is clear that Hospital A, where achieved the most satisfactioin in the quality of treatment, while the Hospital C, where dominated with their staff. Furthermore, Hospital B’s patients were experienced equal satisfaction with waiting time. Looking first […]

The table shows percentage of students giving good ratings for different aspects of a university in China in 2000, 2005, 2010.

The table shows the proportion of learners giving positive feedback for 5 academic fields of a university in china in 3 years 2000,2005 and 2010 Overall, the percentage of students giving good responses for electronic resources rose significantly, whereas technical quality was more slightly. Moreover, print resources was always the highest category but range of […]

The table below shows information about public funding for different arts sectors in the UK in 2010 and 2020. Summarise the information by selecting and reporting the main features, and make comparisons where relevant.

The table gives data about public funding for arts sectors in the United Kingdom in 2010 and 2020. Overall, museums and galleries had the largest funding, while literature had the smallest one . Visual arts had the highest percentage change, whereas the theatre and performing arts had the lowest. In 2010, museums and galleries received […]

the table below shows the percentage of mobile phone owners using various mobile features

The table displays the proportion of mobile phone possessors who used various cellphone features from 2006 to 2010. Overall, it is clear that the popularity of all mobile phone features grew over the years, making phone calls the most dominant feature throughout the timeframe. Moreover, cellphones were usually used for making calls; in stark contrast, […]

The table gives information on the types and fruquency of health issues at Todai Electronics in 2010.

The following table outlines the types and frequency of health issues at Todai Electronics in 2010 and the most common medical treatments required by their employees. Overall, data regarding required medical treatment is categorized into two distinct groups – male and female employees and consequently into another two subgroups – minor care and the need […]

The table below shows the percentage participation of women in senior management in three companies between 1975 and 2015. Summarise the information by selecting and reporting the main features, and make comparisons where relevant.

The table illustrates the proportions of females enrolled in senior management in three different companies over four decades from 1975 to 2015. Overall, Finsbury Ltd showed the highest figure in the first fifteen years, while Eldan Ltd surpassed it in the last twenty five years. Moreover, every company increased throughout the period with some exceptions […]

See All
We have detected unusual activity on your device.
Please verify your identity to continue.
Note: This verification step won't sign you in. If you have a premium account, please log in to access the service as usual.
Google/Gmail Verification
Or verify using Email/Code
We've sent a verification code to:
youremail@gmail.com (Not your email?)
Enter it below to complete the verification process.
Ensure your email address is correct, your inbox is not full, and you check your spam folder. If no email arrives, consider using an alternative email.
You will need a Premium plan to perform your action!
Note: If you already have a premium account, please log in to access our services as usual.

Plans & Pricing

Our mission is to make quality education accessible for everyone.
However, to keep our hardworking team running and this service alive, we genuinely need your support!
By opting for a premium plan, not only do you sustain us in achieving the mission, but you also unlock advanced features to enrich your learning experience.

Free

For learners who aren't pressed for time

What's included on Free
100+ Cambridge IELTS Tests
Instant IELTS Writing Task 1 & 2 Evaluation (2 times/month)
Instant IELTS Speaking Part 1, 2, & 3 Evaluation (2 times/month)
Instant IELTS Writing Task 1 & 2 Essay Generator (2 times/month)
500+ Dictation & Shadowing Exercises
100+ Pronunciation Exercises
Flashcards
Other Advanced Tools

Premium

For those serious about advancing their English proficiency, and for IELTS candidates aspiring to boost their band score by 1-2 points (especially in writing & speaking) in just 30 days or less

What's included on Premium
Save Your IELTS Test Progress & Analyze Mistakes By Question Type
Save Your Own Flashcard Sets & Use Them On Any Device
Unlock All Courses, IELTS Tests, Section & Part Practice
Unlimited AI Conversations
Unlimited AI Writing Enhancement Exercises
Unlimited IELTS Writing Task 1 & 2 Evaluation
Unlimited IELTS Speaking Part 1, 2, & 3 Evaluation
Checked Answers Will Not Be Published
Unlimited IELTS Writing Task 1 & 2 Essay Generator
Unlimited IELTS Speaking Part 1, 2, & 3 Sample Generator
Unlimited Usage Of Advanced Tools & AI Features
Priority Support within 24h (12-month plan only)

Due to the nature of our service and the provided free trials, payments are non-refundable.