24 Hours Only: Get 39% OFF on Our Premium Plan - Check Out Now!
Bar Chart

Band 6+: The charts below show the number of the people in Europe who were effected by four types of noise by day and by night in cities and rural areas in 2007.

Image for topic: The charts below show the number of the people in Europe who were effected by four types of noise by day and by night in cities and rural areas in 2007.
Our system will evaluate the answer based on this AI-generated description.
The image shows two vertical bar charts comparing the impacts of noise from traffic, trains, aircraft, and industry during the day and night on millions of people in Europe in 2007, segmented between cities and rural areas. The first chart, "The number of people who were affected by 4 types of noise during the day and at night in cities (millions)", shows the following daytime noise levels: Traffic 64 million, Train 10 million, Aircraft 4 million, Industry 1 million, and nighttime noise levels: Traffic 48 million, Train 8 million, Aircraft 1 million, Industry 0.25 million. The second chart, "The number of people who were affected by 4 types of noise during the day and at night in rural areas (millions)", shows the following daytime noise levels: Traffic 24 million, Train 6 million, Aircraft 2 million, Industry 1 million, and nighttime noise levels: Traffic 15 million, Train 1 million, Aircraft 0 million, Industry 0 million.
Given the complexity of the image, the above description may not be entirely accurate.
Note: Both the topic and the answer were created by one of our users.

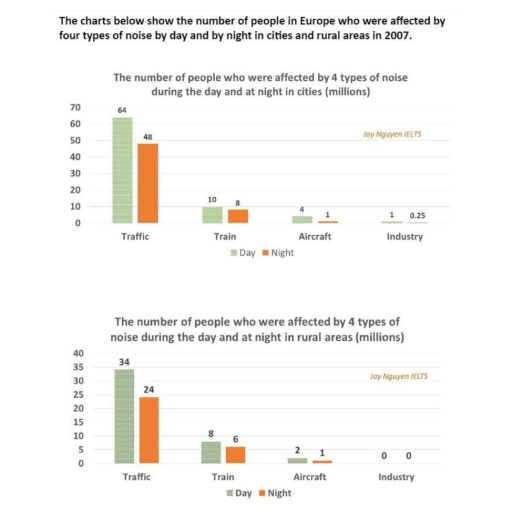
The given chart illustrates four types of noise affect the number of people in Europe by day and night and in urban and rural areas in 2007.

Overall, it can be seen that most pollution of noise is produced by traffic and least by industry in both rural and urban area respectively. There was high noise affection to the people in day.

To begin with, Volume affected people by traffic in day and night was around double in cities than village. While people affected by noise of train were 10 and 8 million in a day and 8 and 6 million in a night in both cities and rural area respectively.

Moreover, volume produced by aircraft strike half to the netizens of village than people of city by 2 million in a day and people affected in night remain same in night at 1 million. No one affected by industry in rural area while 1 million affect in day and 0.25 million in night by industry repectively.

Word Count: 167

Answers On The Same Topic:

The charts below show the number of the people in Europe who were effected by four types of noise by day and by night in cities and rural areas in 2007.

The bar charts illustrate the information about the number of people in Europe who were affected by four types of noise (traffic, train, aircraft, industry) during the day and at night in cities and rural areas in 2007. Overall, in both situations, traffic had the greatest impact on noise levels during the day and night, […]

The charts below show the number of the people in Europe who were effected by four types of noise by day and by night in cities and rural areas in 2007.

The provided charts below illustrate information on the number of people in European cities and rural areas who were bothered by four types of noise in 2007. Starting with the cities, traffic affected 64 million people during the day and 48 million at night. Other sources were less common. Trains disturbed 10 million individuals in […]

The charts below show the number of the people in Europe who were effected by four types of noise by day and by night in cities and rural areas in 2007.

The bar charts demonstrate information about the number of individuals who were affected by train, traffic, aircraft, and industry by night and by day in urban and rural areas in 2007. Overall, it is noticeable that the number of people who were affected by traffic on a day and night constituted the dominant figures in […]

The charts below show the number of the people in Europe who were effected by four types of noise by day and by night in cities and rural areas in 2007.

The bar graphs delineates the information about noise levels occuring during the daytime and at night in urban and rural location in Europe in 2007. From an overall perspective, it is readily apparent that traffic-induced noise was predominant in both rural and urban areas, distantly followed by train, aircraft, and finally industry, while the most […]

See All

Other Topics:

The chart below shows the average hours spent per day in leisure and sports activities by.youngest and oldest populations in the US in 2015.

The graph explains the average hours spent everyday free time and sports activity by youngest and oldest population in US in 2015. The graph compares the distinct time consumption by population os US in 2015. Overall , 6 modes of time consumption are presented in the picture including , Watching TV , Reading , Relaxing/Thinking […]

One hundred adults, boys and girls in Manchester, England were asked to name the sports they participated in. The results were recorded in the following stacked bar chart.

The bar chart represents responses of a group consisting 100 of girls, boys and adults in Manchester, England, when asked in which one of five sports: basketball, swimming, tennis, football and hockey, they have participated. Overall, from their responses, it is clear that the swimming was the most popular sport among all groups. Football and […]

The bar charts displays the ration of the four countries world population

The bar charts displays the ration of the four countries world population in total between 1950 and 200, and their predicted growth for 2050. Overall, the population of india increased steadily over the period. While, China, USA, and Japan experienced a declined. However, japan remained the least populated country in the period given. On one […]

The percentage of young people at a university in 2000 and 2007

The bar graph illustrates the proportion of youth studying at universities in Italy, Spain, the UK, Poland, Norway, and Finland in 2000 and 2007. Overall, it is apparent that the maximum percentage of youngsters enrolled in university in Finland in 2000, whereas Poland had the majority of admissions in 2007. In contrast, the least number […]

The world health organization recommends that people shoud eat five or more portions of fruits and vegetables per day. The chart below shows the percetage of males and females in the UK by age group in 2006.

The bar chart illustrates the percentages of men and women in the UK who consumed at least five portions of fruits and vegetables daily in 2006 across different age groups. Overall, women had higher percentages than men across all age groups, except for the 75+ age group. The figures for both genders increased with age, […]

The bar chart below shows an average daily sales of servings

The given bar chart shows daliy average sales by numbers of serving in winter and summer. The hot-coffee has the higest sales in winter is around 75%.But in summer the sales goes down and the selling average of hot-coffee is 30%.In cold season the ice-coffee orders is only 2%.But in sunny days the iced-coffee demad […]

See All
We have detected unusual activity on your device.
Please verify your identity to continue.
Note: This verification step won't sign you in. If you have a premium account, please log in to access the service as usual.
Google/Gmail Verification
Or verify using Email/Code
We've sent a verification code to:
youremail@gmail.com (Not your email?)
Enter it below to complete the verification process.
Ensure your email address is correct, your inbox is not full, and you check your spam folder. If no email arrives, consider using an alternative email.
You will need a Premium plan to perform your action!
Note: If you already have a premium account, please log in to access our services as usual.

Plans & Pricing

Our mission is to make quality education accessible and free for everyone.
However, to keep our hardworking team running and this service alive, we genuinely need your support!
By opting for a premium plan, not only do you sustain us in achieving the mission, but you also unlock advanced features to enrich your learning experience.

Free

For learners who aren't pressed for time

What's included on Free
1000+ IELTS Tests & Samples
Instant IELTS Writing Task 1 & 2 Evaluation (2 times/month)
Instant IELTS Speaking Part 1, 2, & 3 Evaluation (5 times/month)
Instant IELTS Writing Task 1 & 2 Essay Generator (2 times/month)
500+ Dictation & Shadowing Exercises
100+ Pronunciation Exercises
Flashcards
Other Advanced Tools

Premium

For those serious about advancing their English proficiency, and for IELTS candidates aspiring to boost their band score by 1-2 points (especially in writing & speaking) in just 30 days or less

What's included on Premium
Save Your IELTS Test Progress
Unlock All Courses & Content
Unlimited AI Conversations
Unlimited AI Writing Enhancement Exercises
Unlimited IELTS Writing Task 1 & 2 Evaluation
Unlimited IELTS Speaking Part 1, 2, & 3 Evaluation
Checked Answers Will Not Be Published
Unlimited IELTS Writing Task 1 & 2 Essay Generator
Unlimited IELTS Speaking Part 1, 2, & 3 Sample Generator
Unlimited Usage Of Advanced Tools

Due to the nature of our service and the provided free trials, payments are non-refundable.
Nếu bạn là người Việt Nam và không có hoặc không muốn trả bằng credit/debit cards, bạn có thể thanh toán bằng phương thức chuyển khoản:


Chọn gói:
279,000₫ 157,000 ₫ cho gói 1 tháng (chỉ 5,233₫/ngày)
819,000₫ 397,000 ₫ cho gói 3 tháng (chỉ 4,411₫/ngày)
1,649,000₫ 667,000 ₫ cho gói 6 tháng (chỉ 3,706₫/ngày)
3,299,000₫ 857,000 ₫ cho gói 12 tháng (chỉ 2,381₫/ngày)


Sau khi chuyển khoản, vui lòng đợi trình duyệt tự động điều hướng bạn trở lại Engnovate và bạn sẽ ngay lập tức nhận được mã kích hoạt tài khoản premium.
Nếu có lỗi xảy ra, bạn có thể liên hệ với team thông qua một trong các phương thức: email đến helloengnovate@gmail.com hoặc nhắn tin qua facebook.com/engnovate.
Vì toàn bộ công cụ trên website đều có thể sử dụng thử miễn phí, Engnovate không hỗ trợ hoàn tiền.