🔥 Today Only: Save 30% on Premium — Offer Ends Soon! - Upgrade Now!
Multiple Graphs

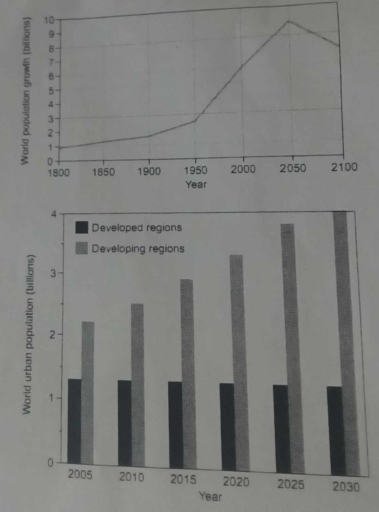
Band 5+: The graphs below provide information on global population figures and figures for urban populations in different world regions. Summarise the information by selecting and reporting the main features, and make comparisons where relevant

Image for topic: The graphs below provide information on global population figures and figures for urban populations in different world regions. Summarise the information by selecting and reporting the main features, and make comparisons where relevant
Our system will evaluate the answer based on this AI-generated description.
The image contains two graphs. The first graph, a line graph, displays the world population from 1800 to 2100 in billions, with points marked at 1800 (approximately 1 billion), 1900 (approximately 1.6 billion), 1950 (approximately 2.5 billion), 2000 (approximately 6 billion), 2050 (around 9 billion), and 2100 (a decline to about 7 billion). The second graph, a bar graph, shows the world urban population in billions, split into developed and developing regions from 2005 to 2030, with values for developed regions in 2005 (approximately 0.9 billion), 2010 (approximately 1 billion), 2015 (approximately 1.1 billion), 2020 (approximately 1.2 billion), 2025 (approximately 1.3 billion), 2030 (approximately 1.4 billion); and for developing regions in 2005 (approximately 1.8 billion), 2010 (approximately 2.2 billion), 2015 (approximately 2.6 billion), 2020 (approximately 3 billion), 2025 (approximately 3.4 billion), 2030 (approximately 3.8 billion).
Given the complexity of the image, the above description may not be entirely accurate.
Note: Both the topic and the answer were created by one of our users.

The line graph shows how much population there was in three various centuries between 19th and 21st. Meanwhile, the bar chart compares the number of people in two different regions of globe (developed and developing regions) from 2015 to 2040.

Overall, it is evident that the world population experienced a significant increase over the period, with a sharp rise in 2040. It is also clear that the proportion of people in urban areas gradually rose throughout the timeline, while the figure for people in rural regions stayed relatively stable.

Initially the number of the world population was below 2000 million, before a slight growth in 1960 this number stayed fairly constant. By contrast, the proportion of global population dramatically rose from approximately 2600 million in 1960, to 8000 million in 2060. However, this number exhibited a slight decline to around 6000 million in the end of the period.

Moreover, the number of people born in evolved regions accounted for approximately 2200 million, in 2015. Seeing a substantial increase every 5 years by the end of the study period their number stood at 4000 million, while the figure for people born in developing areas maintained a steady level at around 1300 million.

Word Count: 201

Answers On The Same Topic:

The graphs below provide information on global population figures and figures for urban populations in different world regions. Summarise the information by selecting and reporting the main features, and make comparisons where relevant

The line graph demonstrates the world population growth from 1800 until projection of year 2100, while the bar chart gives information about world urban residents in both developed and developing regions from 2005 until expectation of 2030. Both figures measured in billions. Overall, it is clear that although the urban citizens number increasing significantly over […]

The graphs below provide information on global population figures and figures for urban populations in different world regions. Summarise the information by selecting and reporting the main features, and make comparisons where relevant

The line graph illustrates data on global population and bar graph provided information for urban populations in different world areas. Overall, it clear that value of world population growth’ fluctuated, while population in developed regions remains same and in developing countries shows upward trend. To start with, in the beginning of the period world population […]

The graphs below provide information on global population figures and figures for urban populations in different world regions. Summarise the information by selecting and reporting the main features, and make comparisons where relevant

The bar chart provide key information for urban population among different areas around the world . The units are measured in million of people. Overall, it is clear from the graph that from 2035 to 2040, the number of million people have a significant increase.in addition, the chart show a notable increase in developing areas […]

The graphs below provide information on global population figures and figures for urban populations in different world regions. Summarise the information by selecting and reporting the main features, and make comparisons where relevant

The line graph shows the population size across three centuries, from the 19th to the 21st. Meanwhile, the bar chart compares the population in two different regions of the globe (developed and developing regions) from 2015 to 2040. Overall, it is evident that the world population experienced a significant increase over the period, with a […]

See All

Other Topics:

The table shows the average annual income of people working in different sectors in 2004 , and the change from 2003. The pie chart shows the distribution of graduates in the different sectors.

The given table compares the average salary in six different sectors ,in 2004, and the changes after a year. The pie chart shows the ratio of graduates who work at different proffesion sectors. Overall, people who worked at the public services had the highest income, while agriculture workers got the lowest salary. In addition, wholesale […]

Mixed graphs. Summarize the information by selecting key information and make comparison where relevant.

The provided visual data encompasses a pie chart and a table illustrating the demographic composition of Australia by nationality and the distribution of these nationalities between urban and rural locales. It is evident that Australians constitute the predominant nationality, while Dutch individuals represent the minimal segment. Additionally, a significant disparity exists in the residency of […]

The charts show survey results concerning why MBA graduates chose their degree, and employer's reasons for hiring them. Summarize the information by selecting and reporting the main features and make comparisons where relevant.

The pie charts illustrate research findings revealing why MBA graduates chose it and why they were employed. It is measured in percentage. Overall, it can be seen that students chose to study MBA because of the high rate of better jobs available, while a few of them actually have a passion to help others. These […]

The charts show survey results concerning why MBA graduates chose their degree, and employer's reasons for hiring them. Summarize the information by selecting and reporting the main features and make comparisons where relevant.

The pie charts illustrates research findings revealing why MBA graduates chose it and why they were employed. It is measured in percentage. Overall, it is can be seen that students chose to study MBA because of the high rate of better jobs available while a few of them actually have passion to help others. These […]

Task 1: The pie charts show the proportion of users across different age groups on three apps:Twitter, Facebook and YouTube. Summarise the information by selecting and reporting the main features, and make comparisons where relevant.

The pie charts illustrate the distribution of users across distinct age groups on three platforms (Facebook, Twitter and YouTube). Overall, the vast majority of users on all the given applications mainly consists of individuals from 18-34 and 35-49 age groups. It is also noticeable that Twitter has the highest concentration of younger adults aged 18-34, […]

Writing task 1 The graph below shows the viewership of different TV programs among three different age groups. Summarise the information by selecting and reporting the main features, and make comparisons where relevant.

The pie chart illustrates the comparison of data about 5 different TV programs that are watched by 3 age groups. Overall, it is clear that cartoons and sports are very popular among younges, while the reverse was true for older viewers. It is also worth mentioning that TV shows proportion remained relatively unchanged. Looking at […]

See All
We have detected unusual activity on your device.
Please verify your identity to continue.
Note: This verification step won't sign you in. If you have a premium account, please log in to access the service as usual.
Google/Gmail Verification
Or verify using Email/Code
We've sent a verification code to:
youremail@gmail.com (Not your email?)
Enter it below to complete the verification process.
Ensure your email address is correct, your inbox is not full, and you check your spam folder. If no email arrives, consider using an alternative email.
You will need a Premium plan to perform your action!
Note: If you already have a premium account, please log in to access our services as usual.

Plans & Pricing

Our mission is to make quality education accessible for everyone.
However, to keep our hardworking team running and this service alive, we genuinely need your support!
By opting for a premium plan, not only do you sustain us in achieving the mission, but you also unlock advanced features to enrich your learning experience.

Free

For learners who aren't pressed for time

What's included on Free
100+ Cambridge IELTS Tests
Instant IELTS Writing Task 1 & 2 Evaluation (2 times/month)
Instant IELTS Speaking Part 1, 2, & 3 Evaluation (5 times/month)
Instant IELTS Writing Task 1 & 2 Essay Generator (2 times/month)
500+ Dictation & Shadowing Exercises
100+ Pronunciation Exercises
Flashcards
Other Advanced Tools

Premium

For those serious about advancing their English proficiency, and for IELTS candidates aspiring to boost their band score by 1-2 points (especially in writing & speaking) in just 30 days or less

What's included on Premium
Save Your IELTS Test Progress
Unlock All Courses & IELTS Tests
Unlimited AI Conversations
Unlimited AI Writing Enhancement Exercises
Unlimited IELTS Writing Task 1 & 2 Evaluation
Unlimited IELTS Speaking Part 1, 2, & 3 Evaluation
Checked Answers Will Not Be Published
Unlimited IELTS Writing Task 1 & 2 Essay Generator
Unlimited IELTS Speaking Part 1, 2, & 3 Sample Generator
Unlimited Usage Of Advanced Tools
Priority Support within 24h (12-month plan only)

Due to the nature of our service and the provided free trials, payments are non-refundable.
Nếu bạn là người Việt Nam và không có hoặc không muốn trả bằng credit/debit cards, bạn có thể thanh toán bằng phương thức chuyển khoản:


Chọn gói:
419,000₫ 277,000 ₫ cho gói 1 tháng (chỉ 9,233₫/ngày)
1,239,000₫ 597,000 ₫ cho gói 3 tháng (chỉ 6,633₫/ngày)
2,469,000₫ 1,027,000 ₫ cho gói 6 tháng (chỉ 5,706₫/ngày)
4,929,000₫ 1,417,000 ₫ cho gói 12 tháng (chỉ 3,936₫/ngày)


Sau khi chuyển khoản, vui lòng đợi trình duyệt tự động điều hướng bạn trở lại Engnovate và bạn sẽ ngay lập tức nhận được mã kích hoạt tài khoản premium.
Nếu có lỗi xảy ra, bạn có thể liên hệ với team thông qua một trong các phương thức: email đến helloengnovate@gmail.com hoặc nhắn tin qua facebook.com/engnovate.
Vì toàn bộ công cụ trên website đều có thể sử dụng thử miễn phí, Engnovate không hỗ trợ hoàn tiền.