Our system will evaluate the answer based on this AI-generated description.
The image shows a bar graph titled 'Over a barrel' with forecasted increases in world oil production for three time periods: 1980-2000, 2000-10, and 2010-20. Three categories of oil-producing regions are represented in each bar: Non-OPEC, Other OPEC, and OPEC Middle East. The y-axis measures million barrels/day in increments of 5, from 0 to 20. From 1980-2000, Non-OPEC production increased by approximately 6 million barrels/day, Other OPEC by roughly 2 million barrels/day, and OPEC Middle East by about 3 million barrels/day. In 2000-10, Non-OPEC production saw an increase close to 4 million barrels/day, Other OPEC approximately 2 million barrels/day, and OPEC Middle East around 8 million barrels/day. For 2010-20, Non-OPEC is predicted to increase by nearly 4 million barrels/day, Other OPEC by approximately 1 million barrels/day, and OPEC Middle East by close to 7 million barrels/day.
Given the complexity of the image, the above description may not be entirely accurate.
Skyrocket your IELTS band score by 1-2 points in under a month with our premium plan!
Note: Both the topic and the answer were created by one of our users.
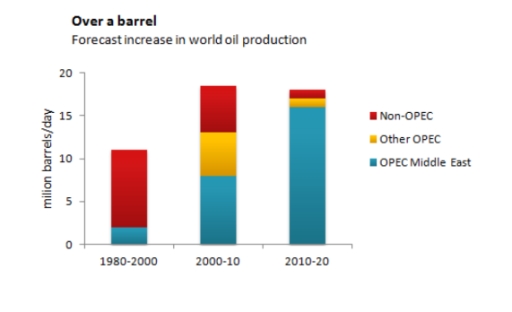
The graph chart illustrates the world’s oil production in three different catagories of contries, over a 50-year of period, starting from 1980.
Overall, it can be seen that the production of oil was the heighest in the Non-OPEC contries, whereas the OPEC middle east produced the lowest amount of oil.
Looking at the data sets it can be seen that the production of oil in Non-OPEC was about 10 million barrels per day in 1980 to 2000. Despite the oil production was increased in 2000 to 2010 with the highest amount of oil, in 2010 to 2020, the production of oil slightly decreased to 18 million barrels per day.
Looking at the rest of the data sets, it is evidence that the oil production in OPEC Middle East was about 3 million barrels per day in 1980 to 2000, which is the lowest value in this graph. However, the amount of production increased rapidly and reach to 16 million barrels per day, in 2010 to 2020. Similarly, Other OPEC contries oil production was about 13 million barrels per day in 2000 to 2010. By 2010 to 2020 it increased to about 18 million barrels per day.
Word Count: 196