Our system will evaluate the answer based on this AI-generated description.
The image contains a line graph showing Twitter use by age group over 8 time points: 10/11, 11/01, 11/05, 11/08, 12/02, 12/08, 12/12, 13/05. Age groups are represented as 18-29, 30-49, 50-64, 65+. At 10/11, 18-29 usage is around 30%, 30-49 around 15%, 50-64 around 5%, 65+ just under 5%. At 11/01, 18-29 increases to just under 35%, 30-49 to just above 15%, 50-64 and 65+ remain steady. At 11/05, 18-29 drops to just above 30%, 30-49 rises to 20%, 50-64 to almost 10%, 65+ to almost 5%. At 11/08, 18-29 rises to just under 35%, 30-49 to just over 20%, 50-64 to just over 10%, 65+ to just over 5%. At 12/02, 18-29 drops to 30%, 30-49 drops to 15%, 50-64 rises to 12.5%, 65+ drops to 5%. At 12/08, 18-29 rises to almost 35%, 30-49 rises to 20%, 50-64 to almost 15%, 65+ to just over 5%. At 12/12, 18-29 drops to just above 30%, 30-49 drops to just over 15%, 50-64 rises to 15%, 65+ to just under 5%. At 13/05, 18-29 rises to just below 35%, 30-49 to just over 20%, 50-64 to just under 15%, 65+ remains steady.
Given the complexity of the image, the above description may not be entirely accurate.
Skyrocket your IELTS band score by 1-2 points in under a month with our premium plan!
Note: Both the topic and the answer were created by one of our users.
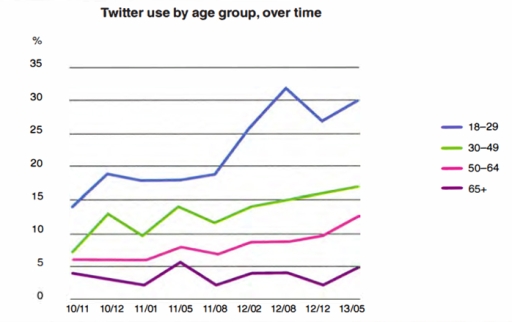
The line graph illustrates how Twitter was used by different age groups in the USA from November 2010 to May 2013. Overall, it is clear that usage increased across all categories, with the 18-29 age bracket consistently showing the highest figures, while the elderly (65+) manifested the lowest levels of engagement.
Regarding the 18-29 age group, the proportion of users started at approximately 15% in late 2010. After a sharp initial rise to 18% within a month, the numbers remained stable until mid-2011. Subsequently, the trend showed a dramatic increase, peaking at about 32% in late 2012 before a slight fluctuation led to a final figure of around 30% in May 2013.
In contrast, the 30-49 and 50-64 age groups followed a more steady upward trajectory. Usage among those aged 30-49 began at roughly 8% and, despite some minor fluctuations, rose significantly to finish at 19% by the end of the period. Similarly, the 50-64 group grew from 6% to nearly 14%, showing a gradual but stable improvement.
Finally, the oldest demographic (65+) remained at the bottom of the graph. Their usage hovered between 3% and 5% throughout the entire timeframe, indicating a much slower adoption of the platform compared to younger generations.
Word Count: 203