Our system will evaluate the answer based on this AI-generated description.
The image consists of a bar graph that depicts the global sales of different types of digital games in billions of dollars from the year 2000 to 2006; four categories are represented: Mobile Phone Games, Online Games, Console Games, and Handheld Games. In 2000, Console Games sales were at 6 billion, Handheld Games at roughly 2.5 billion, and the other two categories had no sales. In 2001, Console Games reached 12 billion, Mobile Phone and Online Games each had sales of under 1 billion, while Handheld Games maintained around 2.5 billion. In 2002, Console Games increased to 18 billion, Online Games surpassed 1 billion, Handheld Games approached 5 billion, and Mobile Phone Games remained under 1 billion. In 2003, Console Games dropped to 12 billion, Online Games exceeded 3 billion, Handheld Games were at approximately 4 billion, while Mobile Phone Games showed a marginal increase. In 2004, Console Games declined to 6 billion, Online and Mobile Phone Games sales were around 2 billion each, and Handheld Games reached 4 billion. In 2005, Console Games sales recovered to 12 billion, Online Games increased to over 6 billion, Handheld Games rose to 6 billion, while Mobile Phone Games maintained around 2 billion. In 2006, Console Games held strong at 12 billion, Online Games jumped to over 12 billion, Handheld Games continued at 6 billion, and Mobile Phone Games stood at almost 3 billion.
Given the complexity of the image, the above description may not be entirely accurate.
Skyrocket your IELTS band score by 1-2 points in under a month with our premium plan!
Note: Both the topic and the answer were created by one of our users.
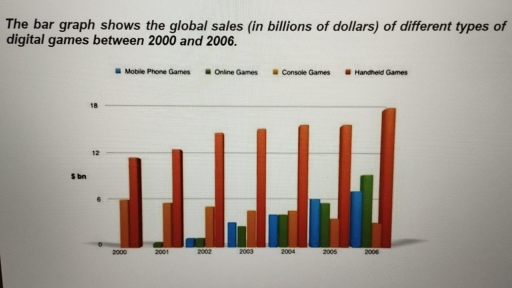
The given bar graph illustrates the global sales of different kinds of digital games from 2000 to 2006.
Overall, console games had a steady downward trend, while, the others grew every year. Among all kinds of games, handheld games had been the most popular one during the period.
Beginning of 2000, handheld games sold nearly 12 billion dollars. It was 2 times larger than the sales of console games. From this year, handheld games had risen slightly each year. In controversy, console games had a small drop every year. Until 2004, handheld games shot up to around 15.5 billion, and stayed at this level next year. Handheld games had reached a peak of almost 18 billion by 2006. However, console games had fallen to 3 billion dollars. Handheld games was 6 times bigger than console games at that time.
Online games started to sell in 2001, and mobile phone games appeared in the next year. In 2012, mobile games and online games both sold about 1 billion. The following year, mobile games sold a little more than the online games, which had 3 billion sales. These two games once again had the same number of 4.5 billion dollars in 2004. A year later, mobile games reached to 6 billion, and had a small increase in 2006. Notably, although online games only rose slightly to nearly 6 billion in 2005, it rose sharply to 9 billion the last year. Finally, it overtook mobile games 1.5 billion dollars.
Word Count: 246