Our system will evaluate the answer based on this AI-generated description.
The image contains a pie chart and a line graph with two keys (ESC and NESC) explaining that ESC refers to workers born in English-speaking countries other than Australia and NESC refers to workers born in non-English-speaking countries. The pie chart shows the workforce in Australia by place of birth in 2003 with percentage values showing Born in Australia 76%, ESC 10%, and NESC 14%. The line graph shows the unemployment in Australia by place of birth from 1993-2003 with percentages on the y-axis ranging from 0 to 8 and years on the x-axis. The graph lines show the unemployment percentage of Australia with a dashed line, ESC with a green line, and NESC with a red line. The unemployment rate in 1993 was approximately 2% for ESC, 2% for Australia, and 6% for NESC. In 1995, ESC had around 3%, Australia had 4%, and NESC had 8%. In 1997, ESC decreased to 2%, Australia went slightly above 2%, and NESC decreased to 6%. In 1999, ESC maintained 2%, Australia increased to 4%, and NESC decreased below 6%. In 2001, all three had around 2%, with NESC showing a slight increase compared to ESC and Australia. In 2003, ESC had just over 2%, Australia had just under 2%, and NESC had around 4%.
Given the complexity of the image, the above description may not be entirely accurate.
Skyrocket your IELTS band score by 1-2 points in under a month with our premium plan!
Note: Both the topic and the answer were created by one of our users.
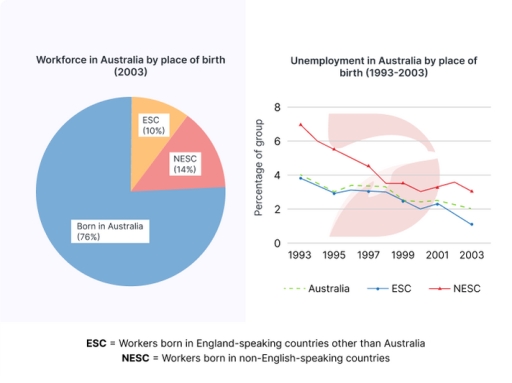
The given pie and line chart respectively illustrate workforce distribution in Australia about three different groups of workers seperated by place of birth in 2003 and ratio of workers unemploying over 10-year duration, commencing 1993
The initial impression from the pie chart is that the percentage of workers born in Australia held the top place during the entire surveyed period. Additionally, concerning line graph, unemployment levels of three categories of workers witnessed a downward trend.
With regard pie chart, in 2003, over three-quarters of the workforce were born in Australia, higher than those from NESC and ESC countries combined, at 14% and 10% respectively.
As regards line graph, in 1993, the figure of unemployment resident born in NESC fluctuated with a downward trend, decreasing from around 7% in 1993 to 3% in 2003. That of native-born Australians and ESC followed a similar trend, with respective levels declining to 2% and 1% at the end of the period
Word Count: 157