Our system will evaluate the answer based on this AI-generated description.
The image depicts a bar chart showing the number of employed persons by job type and sex for Australia last year. The chart has seven categories: Managers, Professionals, Semi-professionals, Tradespeople, Production, Clerical, Labourers. For Managers, there are approximately 700 male and 300 female employed persons. For Professionals, there are about 600 male and 400 female employed persons. For Semi-professionals, there are around 500 male and 500 female employed persons. For Tradespeople, there are approximately 600 male and 200 female employed persons. For Production, there are about 600 male and 400 female employed persons. For Clerical, there are around 200 male and 800 female employed persons. For Labourers, there are approximately 800 male and 200 female employed persons. The chart is measured in 1000s on the x-axis, with a range from 0 to 1000.
Given the complexity of the image, the above description may not be entirely accurate.
Skyrocket your IELTS band score by 1-2 points in under a month with our premium plan!
Note: Both the topic and the answer were created by one of our users.
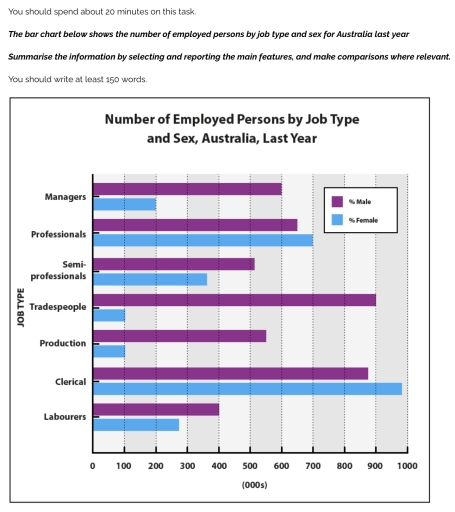
The image depicts a bar graph showing the number of employees working in Australia with respect to gender and job type in the last year.
Overall, the graph suggests 7 job categories, in which the male are dominant in almost all the sectors when compared to woman, with one exclusion in the clerical category where females have taken a lead. About 900 thousand men worked as tradespeople, being the highest working sector, also in the clerical area being the second largest working sector with a figure of more than 800 thousand.
Less than 400 thousand woman work as managers, semi professionals, tradespeople, labourers, and in the production area, whereas the percentage of men in these areas are equal or more.
The highest working sector in females is clerical, and tradespeople in men, whereas the percetnage of woman working in production and tradespeople is least and men working as labourers are just about 400 thousand.
In conclusion more than or eqaul 400 thousand with the maximum percetnage being 900 thousand males are employed in all the job categories, in contrast females being employed is as low as 100 thousand but the highest percentage being almost 1000 thousand.
Word Count: 196