Our system will evaluate the answer based on this AI-generated description.
The image shows a bar graph titled 'Over a barrel' with forecasted increases in world oil production for three time periods: 1980-2000, 2000-10, and 2010-20. Three categories of oil-producing regions are represented in each bar: Non-OPEC, Other OPEC, and OPEC Middle East. The y-axis measures million barrels/day in increments of 5, from 0 to 20. From 1980-2000, Non-OPEC production increased by approximately 6 million barrels/day, Other OPEC by roughly 2 million barrels/day, and OPEC Middle East by about 3 million barrels/day. In 2000-10, Non-OPEC production saw an increase close to 4 million barrels/day, Other OPEC approximately 2 million barrels/day, and OPEC Middle East around 8 million barrels/day. For 2010-20, Non-OPEC is predicted to increase by nearly 4 million barrels/day, Other OPEC by approximately 1 million barrels/day, and OPEC Middle East by close to 7 million barrels/day.
Given the complexity of the image, the above description may not be entirely accurate.
Skyrocket your IELTS band score by 1-2 points in under a month with our premium plan!
Note: Both the topic and the answer were created by one of our users.
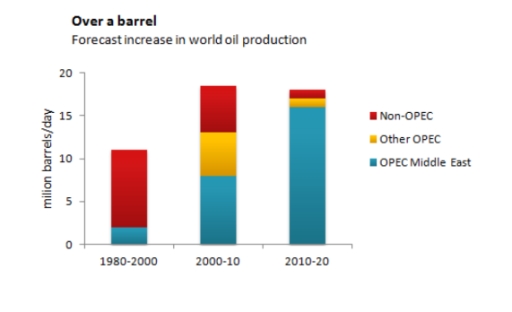
The illustration compares the world’s oil production in OPEC and non-OPEC countries.
Overall, non-OPEC countries’ shares showed a significant decline over the period, while OPEC Middle East dramatically increased its portion. However, other OPEC countries’ fractions, which were low in the beginning, experienced a further decrease.
In detail, in 1980-2000, non-OPEC countries dominated the oil production, producing approximately 10 million barrels per day, whereas OPEC Middle East roughly reached 2 million barrels, sharing the smallest fractions.
In contrast, in 2000-2010, OPEC Middle East significantly enhanced its production to less than 10 million barrels. In comparison, non-OPEC and other OPEC countries each accounted for 5 million barrels.
In 2010-2020, OPEC Middle East rose to more than 15 million barrels, becoming the most dominant figure in the oil production. However, non-OPEC and other OPEC countries demonstrated dramatic drop to nearly 1 million barrels and became figures with the lowest portion of an oil.
Word Count: 151