Our system will evaluate the answer based on this AI-generated description.
The image consists of a bar graph that depicts the global sales of different types of digital games in billions of dollars from the year 2000 to 2006; four categories are represented: Mobile Phone Games, Online Games, Console Games, and Handheld Games. In 2000, Console Games sales were at 6 billion, Handheld Games at roughly 2.5 billion, and the other two categories had no sales. In 2001, Console Games reached 12 billion, Mobile Phone and Online Games each had sales of under 1 billion, while Handheld Games maintained around 2.5 billion. In 2002, Console Games increased to 18 billion, Online Games surpassed 1 billion, Handheld Games approached 5 billion, and Mobile Phone Games remained under 1 billion. In 2003, Console Games dropped to 12 billion, Online Games exceeded 3 billion, Handheld Games were at approximately 4 billion, while Mobile Phone Games showed a marginal increase. In 2004, Console Games declined to 6 billion, Online and Mobile Phone Games sales were around 2 billion each, and Handheld Games reached 4 billion. In 2005, Console Games sales recovered to 12 billion, Online Games increased to over 6 billion, Handheld Games rose to 6 billion, while Mobile Phone Games maintained around 2 billion. In 2006, Console Games held strong at 12 billion, Online Games jumped to over 12 billion, Handheld Games continued at 6 billion, and Mobile Phone Games stood at almost 3 billion.
Given the complexity of the image, the above description may not be entirely accurate.
Skyrocket your IELTS band score by 1-2 points in under a month with our premium plan!
Note: Both the topic and the answer were created by one of our users.
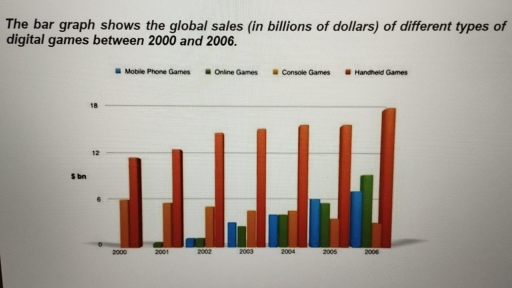
The bar graph provides data about the amount of video game sales revenue in four different types of digital games from 2000 to 2006 .The figures are given in billions of dollars.
Overall, the total number of video games sales increased over the 6-year period. The most dramatic change was seen in the online games, a rise of around 8 billion dollars.
In 2000, the amount of money spent respectively on console games and handheld games was about 6 and 11 billion dollars while no data about users of online and mobile phone games, online games in 2001 and mobile phone games in 2002 entered the virtual games market. The figures for selling online games was around 0.3 billion dollars and the amount of smartphone games sales revenue was approximately 0.5.
In 2006, the amount of gain for handheld games was just over 18 billion dollars. People tended more than online games, that is why, sales of online games increased significantly to 8 billion dollars. The figures for console games was around 3 billion dollars. The amount of money spent on mobile phone games went up considerably to 7 billion dollars.
Word Count: 191