🔥 Today Only: Save 30% on Premium — Offer Ends Soon! - Upgrade Now!
Multiple Graphs

Band 9: The chart and table below show the results of a survey of library users at a university. Summarise the information by selecting and reporting the main features, and make comparisons where relevant.

Image for topic: The chart and table below show the results of a survey of library users at a university. Summarise the information by selecting and reporting the main features, and make comparisons where relevant.
Our system will evaluate the answer based on this AI-generated description.
The image contains a pie chart titled 'Categories of library users' and a table titled 'Library user satisfaction (%)'. The pie chart breaks down library users as follows: Full-time undergraduate 44%, Full-time postgraduate 25%, Part-time postgraduate 16%, Distance learning (all courses) 8%, and Academic staff 7%. The table shows satisfaction levels for five categories: For Library opening hours, 65% were Very satisfied, 35% Fairly satisfied, and 0% Not satisfied. For Helpfulness of staff, 95% were Very satisfied, 5% Fairly satisfied, and 0% Not satisfied. For Availability of books, 50% were Very satisfied, 40% Fairly satisfied, and 10% Not satisfied. For Availability of journals, 45% were Very satisfied, 35% Fairly satisfied, and 20% Not satisfied. For Reliability of wi-fi, 48% were Very satisfied, 33% Fairly satisfied, and 19% Not satisfied.
Given the complexity of the image, the above description may not be entirely accurate.
Note: Both the topic and the answer were created by one of our users.

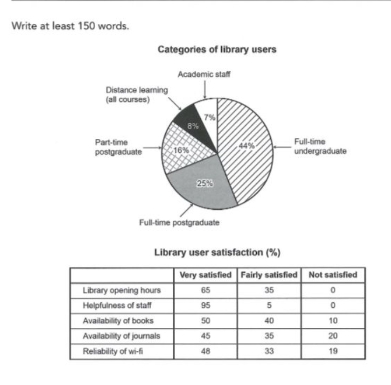
The pie chart illustrates the distribution of five university library user types, while the table presents user satisfaction data regarding various library services.

Overall, full-time undergraduates comprise the largest user segment by a wide margin. Additionally, while library staff helpfulness and opening hours receive the highest approval, journal availability causes the most dissatisfaction.

According to the pie chart, full-time undergraduates constitute nearly half of all users at 44%, followed by full-time postgraduates at exactly 25%. In contrast, part-time postgraduates account for 16%, while distance learners and academic staff represent the smallest shares at 8% and 7%, respectively.

Regarding the survey, staff helpfulness achieves a 100% total satisfaction rate, with 95% of respondents feeling “very satisfied.” Similarly, opening hours receive zero negative feedback. Around half of the users express high satisfaction with book availability (50%) and Wi-Fi reliability (48%), though these features still draw complaints from 10% and 19% of users. Finally, journal availability registers the lowest approval, with 20% dissatisfied.

Word Count: 160

Answers On The Same Topic:

The chart and table below show the results of a survey of library users at a university. Summarise the information by selecting and reporting the main features, and make comparisons where relevant.

The table and chart give information about the final outcome of a survey of library users at the university. Overall, in the category of library users the full-time undergraduate is the highest percentage that others, academic staff is the lowest among other categories. And in library user satisfaction helpfulness of staff is the most satisfied […]

The chart and table below show the results of a survey of library users at a university. Summarise the information by selecting and reporting the main features, and make comparisons where relevant.

The pie chart illustrates the proportions of different categories of university library users, while the table shows how satisfied they were with five aspects of the library’s services. Overall, students accounted for the vast majority of library users, especially full-time undergraduates. Although the library was mainly used by students, users were generally satisfied with its […]

The chart and table below show the results of a survey of library users at a university. Summarise the information by selecting and reporting the main features, and make comparisons where relevant.

The provided pie chart and table illustrate the results of a survey conducted among library users at the university. Overall, the largest segment in the pie chart appears to be Full-time undergraduates, accounting for 44%, while the highest level of user satisfaction reported in the table is 95%. Library users show the most satisfaction with […]

The chart and table below show the results of a survey of library users at a university. Summarise the information by selecting and reporting the main features, and make comparisons where relevant.

The pie chart and information in the second image gives an illustration about the outcomes of different people using library at a university. Overall,the pie chart shows that the percentage of students who are enrolled in full-time undergraduation program use library services more as compared to full-time postgraduates.Part-time postgraduates use library material in high percentage […]

See All

Other Topics:

The charts below show the breakdown of household expenditure in a European country in 1990 and in 2020.

The charts represent the breakdown of household expenditure in a European countries in 1990 and in 2020. Overall, it is clear that both housing and food occupied the most high percentages on chart in both years, while education and other were the lowest in both years. The European household expenditure were breakdown into 6 parts: […]

The graph gives information about the number of yearly visits from France and North America for holiday and business. Summarise the information by selecting and reporting the main features, and make comparisons where relevant.

The line graph demonstrates data about number of yearly visits for two countries,such as from France and North America for holiday and business. Overall,on holiday visits to UK this countries had been to rise gradually and to drop suddenly,whereas on business inspections to UK was fluctuating. Initally,France scale illustrates from January to July it had […]

Task 1: The chart and table below show the life expectancy in 2008 and increase in life expectancy between 1996 and 2008.

The bar chart and table represents proportions of life expectancy in 2008 and its rise from 1996 to 2008 in four countries. Overall, the highest level of life expectancy was in Japan, while the increase in life expectance was in Indonesia. However, Indonesia had the lowest level of life expectance. To begin, it is clear […]

Task 1: The charts below give information about players of electronic games in South Korea in 2003. Summarize the information by selecting and reporting the main features, and make comparisons where relevant.

The given 3 pie charts illustrate information about players of electronic games in South Korea in 2003, categorized by age, gender and game preferences. Overall, it is obvious that digital games are particularly popular among males and young generations. In addition, action games emerged as the most preferred games. Looking first at age, the proportion […]

The graph chart below shows the trends in use of three entertainment preferences from 2005 to 2011.

While the line graph gives information on how many people went to cinema, dowloaded music and others and bought DVD,measured in arbitrary, for 7 consecutive year, starting from 2005 the two pie charts demonstrates the percentage of people who chose these three categories in two different years: 2005 and 2011. Overall, the number of people […]

See All
We have detected unusual activity on your device.
Please verify your identity to continue.
Note: This verification step won't sign you in. If you have a premium account, please log in to access the service as usual.
Google/Gmail Verification
Or verify using Email/Code
We've sent a verification code to:
youremail@gmail.com (Not your email?)
Enter it below to complete the verification process.
Ensure your email address is correct, your inbox is not full, and you check your spam folder. If no email arrives, consider using an alternative email.
You will need a Premium plan to perform your action!
Note: If you already have a premium account, please log in to access our services as usual.

Plans & Pricing

Our mission is to make quality education accessible for everyone.
However, to keep our hardworking team running and this service alive, we genuinely need your support!
By opting for a premium plan, not only do you sustain us in achieving the mission, but you also unlock advanced features to enrich your learning experience.

Free

For learners who aren't pressed for time

What's included on Free
100+ Cambridge IELTS Tests
Instant IELTS Writing Task 1 & 2 Evaluation (2 times/month)
Instant IELTS Speaking Part 1, 2, & 3 Evaluation (5 times/month)
Instant IELTS Writing Task 1 & 2 Essay Generator (2 times/month)
500+ Dictation & Shadowing Exercises
100+ Pronunciation Exercises
Flashcards
Other Advanced Tools

Premium

For those serious about advancing their English proficiency, and for IELTS candidates aspiring to boost their band score by 1-2 points (especially in writing & speaking) in just 30 days or less

What's included on Premium
Save Your IELTS Test Progress & Analyze Mistakes By Question Type
Unlock All Courses & IELTS Tests
Unlimited AI Conversations
Unlimited AI Writing Enhancement Exercises
Unlimited IELTS Writing Task 1 & 2 Evaluation
Unlimited IELTS Speaking Part 1, 2, & 3 Evaluation
Checked Answers Will Not Be Published
Unlimited IELTS Writing Task 1 & 2 Essay Generator
Unlimited IELTS Speaking Part 1, 2, & 3 Sample Generator
Unlimited Usage Of Advanced Tools
Priority Support within 24h (12-month plan only)

Due to the nature of our service and the provided free trials, payments are non-refundable.
Nếu bạn là người Việt Nam và không có hoặc không muốn trả bằng credit/debit cards, bạn có thể thanh toán bằng phương thức chuyển khoản:


Chọn gói:
419,000₫ 277,000 ₫ cho gói 1 tháng (chỉ 9,233₫/ngày)
1,239,000₫ 597,000 ₫ cho gói 3 tháng (chỉ 6,633₫/ngày)
2,469,000₫ 1,027,000 ₫ cho gói 6 tháng (chỉ 5,706₫/ngày)
4,929,000₫ 1,417,000 ₫ cho gói 12 tháng (chỉ 3,936₫/ngày)


Sau khi chuyển khoản, vui lòng đợi trình duyệt tự động điều hướng bạn trở lại Engnovate và bạn sẽ ngay lập tức nhận được mã kích hoạt tài khoản premium.
Nếu có lỗi xảy ra, bạn có thể liên hệ với team thông qua một trong các phương thức: email đến helloengnovate@gmail.com hoặc nhắn tin qua facebook.com/engnovate.
Vì toàn bộ công cụ trên website đều có thể sử dụng thử miễn phí, Engnovate không hỗ trợ hoàn tiền.