Our system will evaluate the answer based on this AI-generated description.
The image shows population growth (in thousands) from 1992 to 2016 for Melbourne, Sydney, and Brisbane. In 1992: Melbourne 20, Sydney 40, Brisbane slightly above 20. In 1993: Melbourne around 20, Sydney 40, Brisbane slightly below 20. In 1994: Melbourne below 40, Sydney around 25, Brisbane between 20-40. In 1995: Melbourne around 40, Sydney below 20, Brisbane below 40. In 1996: Melbourne around 40, Sydney below 40, Brisbane around 40. In 1997: Melbourne slightly above 40, Sydney around 25, Brisbane around 40. In 1998: Melbourne around 40, Sydney around 40, Brisbane below 40. In 1999: Melbourne above 40, Sydney around 40, Brisbane around 40. In 2000: Melbourne above 40, Sydney slightly above 40, Brisbane below 40. In 2001: Melbourne around 60, Sydney around 60, Brisbane below 40. In 2002: Melbourne 80, Sydney around 80, Brisbane slightly above 40. In 2003: Melbourne around 80, Sydney below 40, Brisbane around 60. In 2004-2005: Melbourne around 80, Sydney below 40, Brisbane below 40. In 2006: Melbourne around 100, Sydney above 60, Brisbane above 40. In 2007: Melbourne around 120, Sydney above 80, Brisbane around 40. In 2008: Melbourne around 120, Sydney above 40, Brisbane around 60. In 2009: Melbourne below 100, Sydney above 60, Brisbane around 60. In 2010: Melbourne below 100, Sydney below 60, Brisbane around 40. In 2011: Melbourne slightly above 100, Sydney below 80, Brisbane below 60. In 2012: Melbourne slightly below 120, Sydney slightly above 80, Brisbane below 60. In 2013: Melbourne around 120, Sydney around 100, Brisbane around 60. In 2014: Melbourne 100 to 80, Sydney below 80, Brisbane above 60. In 2015: Melbourne above 100, Sydney slight drop then up from slightly below 80 to around 100
Given the complexity of the image, the above description may not be entirely accurate.
Skyrocket your IELTS band score by 1-2 points in under a month with our premium plan!
Note: Both the topic and the answer were created by one of our users.
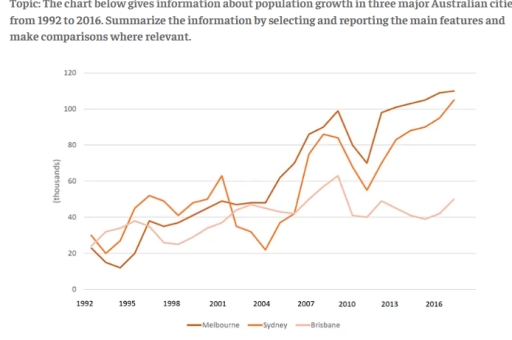
The line graph shows the changes in population for three countries in Australia: Melbourne, Sydney and Brisbane over a period of 25 years.
Overall, all three cities started at similar levels also Melbourne and Sydney showed almost the same pattern. Moreover population in these countries growth especially in Melbourne, while Brisbane had the smaller population.
In 1992, Melbourne’s population was nearly 20% and about 30% in Sydney. Both cities saw a slight decline but in the 1995 Sydney’ population rose to approximately 25% , while Melbourne reached the low at around 18% and since this period they followed a similar growth with different 5%, where Melbourne was lower. However, then Sydney showed significant fell to nearly 35% and Melbourne was around 47%. Thereafter Melbourne surpassed Sydney’s population to around 5%, and by the end of the period, Melbourne’s population was roughly 110%, about 4% more than Sydney.
In contrast, Brisbane’s population in 1992 was just over Melbourne’s but it did not show significant growth until the period between 2007 and 2010, when it rose from around 43 to% just over 60%. However, after that Brisbane’s population began decline, in totally was nearly to 50, show a significant difference compared to the other citries.
Word Count: 203