Our system will evaluate the answer based on this AI-generated description.
The image presents a line graph detailing monthly average rainfall (mm) for Marrakesh, Dublin, Nur-Sultan, Sydney, and Tokyo in 2020; in January, Marrakesh records ~145mm, Dublin ~80mm, Nur-Sultan ~25mm, Sydney ~120mm, Tokyo ~50mm; in February, Marrakesh ~130mm, Dublin ~80mm, Nur-Sultan ~20mm, Sydney ~110mm, Tokyo ~55mm; in March, Marrakesh ~127mm, Dublin ~75mm, Nur-Sultan ~30mm, Sydney ~125mm, Tokyo ~70mm; in April, Marrakesh ~120mm, Dublin ~65mm, Nur-Sultan ~40mm, Sydney ~120mm, Tokyo ~85mm; in May, Marrakesh ~120mm, Dublin ~60mm, Nur-Sultan ~50mm, Sydney ~105mm, Tokyo ~100mm; in June, Marrakesh ~110mm, Dublin ~55mm, Nur-Sultan ~60mm, Sydney ~95mm, Tokyo ~120mm; in July, Marrakesh ~130mm, Dublin ~50mm, Nur-Sultan ~65mm, Sydney ~75mm, Tokyo ~130mm; in August, Marrakesh ~165mm, Dublin ~60mm, Nur-Sultan ~70mm, Sydney ~85mm, Tokyo ~145mm; in September, Marrakesh ~170mm, Dublin ~60mm, Nur-Sultan ~55mm, Sydney ~90mm, Tokyo ~140mm; in October, Marrakesh ~178mm, Dublin ~80mm, Nur-Sultan ~45mm, Sydney ~110mm, Tokyo ~130mm; in November, Marrakesh ~185mm, Dublin ~90mm, Nur-Sultan ~40mm, Sydney ~120mm, Tokyo ~115mm; in December, Marrakesh ~180mm, Dublin ~90mm, Nur-Sultan ~30mm, Sydney ~125mm, Tokyo ~80mm.
Given the complexity of the image, the above description may not be entirely accurate.
Skyrocket your IELTS band score by 1-2 points in under a month with our premium plan!
Note: Both the topic and the answer were created by one of our users.
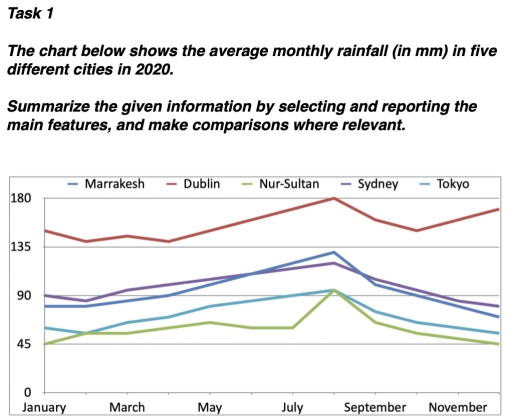
The line graph provided shows the monthly average of rainfall in mm of five different cities of 2020. The cities included in data are Marrakesh, Dublin, Nur-Sultan, Sydney, and Tokyo. It is explicit that between July and September every city touches peak of average lenght of rainfall as compared to other months of the year.
Dublin has the highest average of height of rainfall of 180 mm which is reported between July and September of 2020. As compared to others, the peak length of second most heightest in rainfall which is Marrakesh at just below 130 mm, is still lower than the lowest crest of data of Dublin which is around 140 mm.
Meanwhile, the data for rainfall in Sydney and Marrakesh has a lot of simmilarity when compared to other cities. The average height of rainfall in both the cites was almost same between May and July at around 150 mm and in-between of September at 165 mm. in the line chart of both cities it is reported that there is a maximum variation of not more than 5 mm.
Word Count: 181