Our system will evaluate the answer based on this AI-generated description.
The image displays a bar chart illustrating global sales in billion dollars from 2000 to 2006 across four game categories: mobile phone games, online games, console games, and handheld games. In 2000, mobile phone and online games had negligible sales, console games at approximately 6 billion, and handheld games at roughly 11 billion. In 2001, mobile and online games were still negligible, console games remained around 6 billion, handheld games rose slightly above 12 billion. In 2002, mobile games had negligible presence, online games started near 1 billion, console games slid slightly below 6 billion, handheld games stayed over 12 billion. In 2003, mobile games neared 1 billion, online games approached 2 billion, console games just above 4 billion, handheld games exceeded 12 billion. In 2004, mobile games increased close to 2 billion, online games over 2 billion, console games saw a marginal rise, handheld games neared 14 billion. In 2005, mobile and online games both stood just above 3 billion, console games hovered around 6 billion, handheld games surpassed 14 billion. In 2006, mobile games were slightly below 4 billion, online games reached about 6 billion, console games remained steady, and handheld games peaked significantly over 16 billion.
Given the complexity of the image, the above description may not be entirely accurate.
Skyrocket your IELTS band score by 1-2 points in under a month with our premium plan!
Note: Both the topic and the answer were created by one of our users.
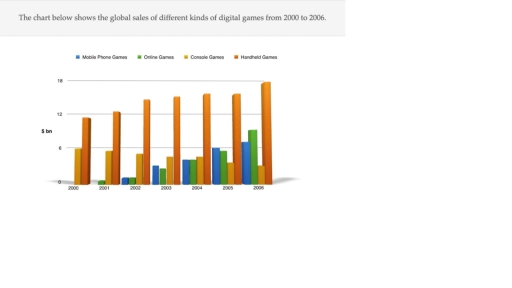
The bar chart compares the global sales (in billions of dollars) of Mobile Phone, Online, Console, and Handheld Games between 2000 and 2006. Overall, while Handheld, Online, and Mobile Phone Games increased steadily over time, Console Games declined considerably throughout the years, widening the gap with the other categories.
With regard to Handheld Games, they remained the most popular group among digital games, climbing considerably from just below $12 billion in 2000 to approximately $18 in 2006. Online Games showed a similar trend but with considerably lower figures. They appeared in the market only in 2001, accounting for only $1 billion before rising steadily in the next 5 years. By the end of 2006, they had reached roughly $8 billion, ranking second among the different types of games. Mobile Phones Games also showed a noticeable upward trend. They started at approximately $2 billion in 2002, before briefly surpassing Online Games in 2005 at exactly $6 billion. Although they kept growing, they were subsequently overtaken by Online Games by the end of the period, standing at roughly $7. In contrast, Console Games started second at just below $6 billion, then dropping steadily to $5 billion in 2004, before being surpassed by the other types in 2005. By 2006 sales had fallen to a low of only $3 billion.
On the whole, although Handheld Games remained by far the most sold type of digital games throughout the period, the remaining categories also showed a remarkable upward trend compared to the Console Games, which declined steadily
Word Count: 253