24 Hours Only: Get 39% OFF on Our Premium Plan - Check Out Now!
Multiple Graphs

Band 6+: The diagram shows differences in temperature zones between tropical mountains and temperate mountains.

Image for topic: The diagram shows differences in temperature zones between tropical mountains and temperate mountains.
Our system will evaluate the answer based on this AI-generated description.
The image displays the temperature zones between tropical mountains and temperate mountains, divided into Warm, Cool, Temperate, Forest, Alpine meadows, and Tropical mountains. Altitude in meters and feet is given. Warm zone: suitable for mainly tropical crops (1000-1500 meters/3000-5000 feet), Cool zone: used for coffee and cocoa plantations (1500-2500 meters/5000-8000 feet), Temperate zone: used for coffee and cocoa plantations (2500-3000 meters/8000-10000 feet), Forest: limit for pine trees (2500-3500 meters/8000-11500 feet), Cool zone: general cultivation of grains, potatoes, flax (3000-4000 meters/10000-13000 feet), Alpine meadows (3500-4500 meters/11500-14500 feet), Temperate mountain: Alpine meadows (3500-4500 meters/11500-14500 feet), Tropical mountain: Alpine meadows (4000-5500 meters/13000-17000 feet), Forest: limit for broad-leaf trees (3500-4500 meters/11500-14500 feet), Alpine meadows: limit for pine trees (4500 meters/14500 feet), Alpine meadows: permanent snow line (4500-5000 meters/14500-16000 feet), Tropical mountain: permanent snow line (5000 meters/16000 feet), Temperate mountain: permanent snow line (5000 meters/16000 feet).
Given the complexity of the image, the above description may not be entirely accurate.
Note: Both the topic and the answer were created by one of our users.

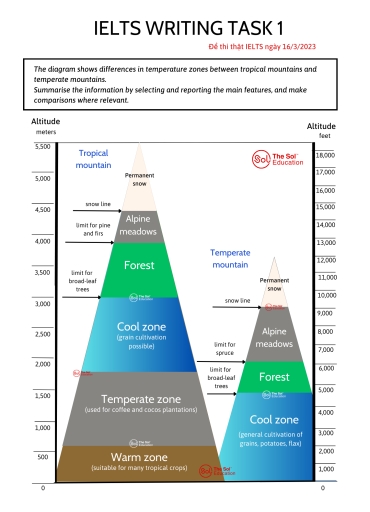
The diagram gives a visual representation of the variations in temperatures in tropical and temperate mountains.

Overall, it is evident that tropical mountains are higher, so they have a more diverse environment that includes a warm zone, which temperate mountains do not have.

Regarding tropical mountains, the first 1000 meters represent a warm zone suitable for cultivating tropical crops. It is followed by a temperature zone located at an altitude of 1000-1500, which can be used for coffee and cacao plantations. Above, there is a cool area where grain can be grown. Forests thrive at an height between 3000 and 4000 meters; however, this zone has a limit for broad-leaf trees. With regards to the two last zones, only alpine meadows lie at an altitude of 4000-4500 meters, with permanent snow above them.

In contrast, a cool zone in temperate mountains is more extensive and starts at the foot and ends at an altitude of 5000, it is a good place to plant grains, potatoes, and flax. Forests are less vast; they extend in elevation from 5000 and 6000 meters. Nevertheless, the zone has rish alpine meadows, which can survive at an elevation of between 6000 and 10000 meters. The highest zone of permanent snow is between 1000 and 11,000 meters.

Word Count: 211

Answers On The Same Topic:

The diagram shows differences in temperature zones between tropical mountains and temperate mountains.

The diagram illustrates how temperature zones differ by altitude between tropical and temperate mountains. Overall, the tropical mountains span a significantly broader vertical range, and contain more distinct ecological zones. Meanwhile, the permanent snow line is positioned at a much higher altitude in the tropics. In the tropical regions, the warm zone stretches from sea […]

The diagram shows differences in temperature zones between tropical mountains and temperate mountains.

The diagram illustrated the difference between tropical mountain and temperature mountain which is a place for planting different species along with its altitude. There are six groups in tropical mountain and four groups in temperate mountain. To beign with the tropical mountain, there has a warm zone which is suitable for many tropical crops such […]

The diagram shows differences in temperature zones between tropical mountains and temperate mountains.

The diagram compares different altitude zones of vegetation and temperature on tropical and temperate mountains, based on changes in climate and land use at various elevations. Overall, the tropical mountain has a wider range of distinct zones and supports vegetation at much higher altitudes. In contrast, the temperate mountain has fewer zones, and the limits […]

The diagram shows differences in temperature zones between tropical mountains and temperate mountains.

The given diagram represents comparison in temperature zones between tropical mountains and temperate mountains. Overall, vegetation in tropical moutains are more diverse than that of temperate mountains. Tropical mountains are higher altitude than temperate mountains. There is a snow line at about 2800 meters (10000 feets) on temperate mountains, which are shorter than that of […]

The diagram shows differences in temperature zones between tropical mountains and temperate mountains.

The diagram gives information about and how temperature zones and tropical mountains and temperate mountains different about temperature zones. Overall, it is clear that tropical mountain has more various temperature zones than temperate mountain. The cultivation of each mountain have a big difference. Regarding lower altitude (below 3,000 meters), the cool zone in tropical mountain, […]

See All

Other Topics:

You should spend about 20 minutes on this task. The pie chart shows the percentage of women in poverty and the bar chart shows poverty rates by sex and age. They are from the United States in 2008. Summarise the information by selecting and reporting the main features and make comparisons where relevant. Write at least 150 words.

Introduction: the first circluar chart explain the information of a survey which conducted 2008 about females who are in poverty due to the family responsibilities of their kids.The another chart show the maximum or mininum rates of poverty by gender and age. At the first glance ,the most highest percentages of wonens under poverty were […]

The charts below show the average amounts of three types of nutrients in typical meals, all of which can be unhealthy if consumed too much. Summarise the information by selecting and reporting the main features, and make comparisons where relevant.

The pie charts illustrate the data about the average amount of 3 kinds of nutrients in ordinary meals in the UK, all of which can harm well-being of a person if consumed excessively. Overall, sodium and saturated fat are consumed mostly in dinner, while added sugar is more common for snacks. These nutrients vary in […]

Part 1: The graph below shows the weekly working hours or men and women omen in in government institutions and private institutions.

The pie chart compare weekly worked of females and males in two different institutions government and private. Overall, while the proportion of hours of females in both government and private sector was relatively identical, the figures of hours of males of government sector were considerably higher than private sector. Notably, proportion of women working more […]

The charts below show the average percentages in typical meals of three types of nutrients all of which may be unhealthy if eaten too much

The pie graphs illustrates the mean proportions of three nutrients in common food intake, each of which can be harmful to health if consumed in excess. Overall, dinner is the primary source of both sodium and saturated fat intake for people, while snacks contribute the highest percentage of added sugar. In contrast, breakfast consistently accounts […]

WRITING TASK 1 You should spend about 20 minutes on this task. The chart below shows the value of one country's exports in various categories during 2015 and 2016. The table shows the percentage change in each category of exports in 2016 compared with 2015. Summarise the information by selecting and reporting the main features, and make comparisons where relevant. Write at least 150 words.

The chart below illustrates the export earnings of a certain country in five categories during 2015 and 2016, while the table gives information about the percentage change in values in each category of exports in 2016 compared with 2015. In general, all of the products experienced an upward trend in the sales of export except […]

The pie charts below compare the percentages of users across different age groups on Twitter, Facebook, and YouTube. Summarise the information by selecting and reporting the main features, and make comparison where relevant.

The pie charts compare the users of three different social media platforms across various ages. Overall, it is clear that the age groups of people aged 18-34 and 35-49 are the main users of such sites, whereas the reverse is true for other age demographics. Focusing on people aged between 18 and 34, the percentage […]

See All
We have detected unusual activity on your device.
Please verify your identity to continue.
Note: This verification step won't sign you in. If you have a premium account, please log in to access the service as usual.
Google/Gmail Verification
Or verify using Email/Code
We've sent a verification code to:
youremail@gmail.com (Not your email?)
Enter it below to complete the verification process.
Ensure your email address is correct, your inbox is not full, and you check your spam folder. If no email arrives, consider using an alternative email.
You will need a Premium plan to perform your action!
Note: If you already have a premium account, please log in to access our services as usual.

Plans & Pricing

Our mission is to make quality education accessible for everyone.
However, to keep our hardworking team running and this service alive, we genuinely need your support!
By opting for a premium plan, not only do you sustain us in achieving the mission, but you also unlock advanced features to enrich your learning experience.

Free

For learners who aren't pressed for time

What's included on Free
100+ Cambridge IELTS Tests
Instant IELTS Writing Task 1 & 2 Evaluation (2 times/month)
Instant IELTS Speaking Part 1, 2, & 3 Evaluation (5 times/month)
Instant IELTS Writing Task 1 & 2 Essay Generator (2 times/month)
500+ Dictation & Shadowing Exercises
100+ Pronunciation Exercises
Flashcards
Other Advanced Tools

Premium

For those serious about advancing their English proficiency, and for IELTS candidates aspiring to boost their band score by 1-2 points (especially in writing & speaking) in just 30 days or less

What's included on Premium
Save Your IELTS Test Progress
Unlock All Courses & IELTS Tests
Unlimited AI Conversations
Unlimited AI Writing Enhancement Exercises
Unlimited IELTS Writing Task 1 & 2 Evaluation
Unlimited IELTS Speaking Part 1, 2, & 3 Evaluation
Checked Answers Will Not Be Published
Unlimited IELTS Writing Task 1 & 2 Essay Generator
Unlimited IELTS Speaking Part 1, 2, & 3 Sample Generator
Unlimited Usage Of Advanced Tools

Due to the nature of our service and the provided free trials, payments are non-refundable.
Nếu bạn là người Việt Nam và không có hoặc không muốn trả bằng credit/debit cards, bạn có thể thanh toán bằng phương thức chuyển khoản:


Chọn gói:
279,000₫ 157,000 ₫ cho gói 1 tháng (chỉ 5,233₫/ngày)
819,000₫ 397,000 ₫ cho gói 3 tháng (chỉ 4,411₫/ngày)
1,649,000₫ 667,000 ₫ cho gói 6 tháng (chỉ 3,706₫/ngày)
3,299,000₫ 857,000 ₫ cho gói 12 tháng (chỉ 2,381₫/ngày)


Sau khi chuyển khoản, vui lòng đợi trình duyệt tự động điều hướng bạn trở lại Engnovate và bạn sẽ ngay lập tức nhận được mã kích hoạt tài khoản premium.
Nếu có lỗi xảy ra, bạn có thể liên hệ với team thông qua một trong các phương thức: email đến helloengnovate@gmail.com hoặc nhắn tin qua facebook.com/engnovate.
Vì toàn bộ công cụ trên website đều có thể sử dụng thử miễn phí, Engnovate không hỗ trợ hoàn tiền.