🔥 Today Only: Save 30% on Premium — Offer Ends Soon! - Upgrade Now!
Table

Band 4+: The first chart below shows the results of a survey which sampled a cross-section of 100,000 people asking if they travelled abroad and why they travelled for the period 1994-98. The second chart shows their destinations over the same period. Write a report for a university lecturer describing the information shown below. You should write at least 150 words.

Image for topic: The first chart below shows the results of a survey which sampled a cross-section of 100,000 people asking if they travelled abroad and why they travelled for the period 1994-98. The second chart shows their destinations over the same period. Write a report for a university lecturer describing the information shown below. You should write at least 150 words.
Our system will evaluate the answer based on this AI-generated description.
The image presents two tables. The first table, "Visits Abroad by UK Residents by Purpose of Visit (1994-98)," lists: for holidays—1994: 15,246; 1995: 14,898; 1996: 17,896; 1997: 19,703; 1998: 20,700; for business—1994: 3,155; 1995: 3,188; 1996: 3,249; 1997: 3,639; 1998: 3,957; for visits to friends and relatives—1994: 2,689; 1995: 2,628; 1996: 2,774; 1997: 3,051; 1998: 3,181; for other reasons—1994: 982; 1995: 1,382; 1996: 1,519; 1997: 1,054; 1998: 990; with total visits—1994: 22,072; 1995: 21,610; 1996: 24,949; 1997: 27,447; 1998: 28,828. The second table, "Destinations of Visits Abroad by UK Residents by Main Region (1994-98)," lists visits to Western Europe—1994: 19,371; 1995: 18,944; 1996: 19,580; 1997: 20,700; 1998: 24,519; to North America—1994: 919; 1995: 914; 1996: 1,167; 1997: 1,188; 1998: 1,823; to other areas—1994: 1,782; 1995: 1,752; 1996: 1,982; 1997: 2,188; 1998: 2,486; with total visits—1994: 22,072; 1995: 21,610; 1996: 24,949; 1997: 24,449; 1998: 28,828.
Given the complexity of the image, the above description may not be entirely accurate.
Note: Both the topic and the answer were created by one of our users.

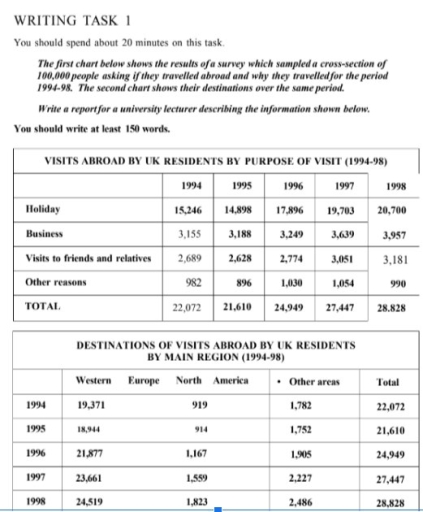
The two tables gives the information of reaon of abroad visit and their destination during the year 1994-98 from a random 100,000 UK citizens.

Overall the croud like to enjoy their holidays in abroad countries and in the year 1998 the total was astonishing number of 20,700.They preferred to go to western Europe than North America and other areas.

Firstly, the number of masses desire foreign travel was increasing exponentially from 22,072 to 28,828.The major reasons for their travel is for Business, Holiday, Visit to friends and family and other reasons.In 1998 the 20700, 3957, 3181, 990 travellers travel for Holiday, Business, Visit to friends and family and other reasons respectively.

Secondly, UK citizens mostly visit Western Europe with a dashing number of 24519, 23661, 21877, 18944, 19371 in the years 1998, 1997, 1996, 1995, 1994 respectively.The people going to North America and other areas are increasing gradually over the duration.

Word Count: 151

Answers On The Same Topic:

The first chart below shows the results of a survey which sampled a cross-section of 100,000 people asking if they travelled abroad and why they travelled for the period 1994-98. The second chart shows their destinations over the same period. Write a report for a university lecturer describing the information shown below. You should write at least 150 words.

The two table charts provide information in abroad travel by 100,000 UK residents between year 1994 and 1998, outlining purpose and destinations. Overall, it can be noticeable that holiday travel was the primary reason for visiting abroad, which considered as rising in number over the five-year period. Additionally, Western Europe destination was significantly increasing, while […]

The first chart below shows the results of a survey which sampled a cross-section of 100,000 people asking if they travelled abroad and why they travelled for the period 1994-98. The second chart shows their destinations over the same period. Write a report for a university lecturer describing the information shown below. You should write at least 150 words.

The first tebular data demonstrate the conducted surveys of 100,000 people of UK residence and asking them if they were travelled abroad and the purpose of travel in between 1994 to 1998. Moreover, 2nd table illustrates location they prefer to travel over the time period. Overview, The purpose of visit were seen most in holiday […]

The first chart below shows the results of a survey which sampled a cross-section of 100,000 people asking if they travelled abroad and why they travelled for the period 1994-98. The second chart shows their destinations over the same period. Write a report for a university lecturer describing the information shown below. You should write at least 150 words.

The table illustrates the visits to places abroad by UK residents from the year 1994-98 for different purposes, such as holidays, business, visits to friends and relatives, or for any other reasons. The second table depicts the destinations, such as Western Europe, North America, and other places abroad, visited by UK residents by main region […]

The first chart below shows the results of a survey which sampled a cross-section of 100,000 people asking if they travelled abroad and why they travelled for the period 1994-98. The second chart shows their destinations over the same period. Write a report for a university lecturer describing the information shown below. You should write at least 150 words.

The table illustrate the visits to abroad places by UK residents from year 1994-98 for different purposes like for holiday, business, visits to friend and relatives or for any other reasons. The second table depict the destinations like Western Europe, North America, other abroad places visited by UK residents by main region from 1994-98. Here, […]

The first chart below shows the results of a survey which sampled a cross-section of 100,000 people asking if they travelled abroad and why they travelled for the period 1994-98. The second chart shows their destinations over the same period. Write a report for a university lecturer describing the information shown below. You should write at least 150 words.

The tables compare the number of trips made abroad by UK residents between 1994 and 1998, classified by purpose of travel and destination. Overall, the total volume of overseas travel increased over the period despite a slight decline in 1995. Holidays consistently represented the main reason for travelling abroad, while Western Europe remained by far […]

See All

Other Topics:

The table below shows the information about the posts held by women in parliament and in management in 5 countries in 2000. Summarise the information by selecting and reporting the main features and make comparisons where relevant.

The given table compares the percentages of positions of women in government and management in five different nations, comprising Canada, Norway, Tobago and Trinidad, Uruguay, and Italy, in 2000. Overall, the proportions of the posts held by females in parliament were higher than that in management in all countries. Additionally, while Norway accounted for the […]

Finding out main information by selecting and reporting and make comparisons where relevant EE ki

The table illustrates the percentage of pupils enrolled in four types of secondary schools, namley Specialist Schools, Grammar Schools, Voluntary-controlled Schools, and Community Schools- across the years 2000, 2005, and 2009. Overall, while the proportion of students attending Community Schools increased significantly over the period, all other school types experienced a consistent decline in enrolment. […]

The table below gives average yearly weather statistics of four cities.

The table shows average annual weather statistics in four capital cities: Edinburgh, Paris, Helsinki, and Casablanca. The information given includes annual rainfall, the number of wet days, annual snowfall, the annual temperature range and the hours of sunlight per day. Overall, the rainiest city of this group is Edinburgh, while the most humid is Helsinki […]

The tables below give information about the consumption and production of potatoes in different world regions in 2006. Summarize the information by selecting and reporting the main features, and make comparisons where relevant.

The table show information about potato consumption and production in different region in 2006. Overall the table illustrate that the highest per person consumption in lg is in Europe . The lowest also per person consumption in kg is in Africa . In terms of production the asia/ ocenia had highest . Europe follow closely […]

the table below shows the results of survey of first-year students who take courses in a particular university

The table illustrates the percentage of students gave good ratings for different aspects of a university in three different years. Overall, it is clear that the highest proportions of rating witnessed by the print and electronic resources, while range of models offered had the significant lowest throughout the period. In detail, print resources accounted for […]

The chart below shows the percentage of households owning different types of technology in a country in 1995 and 2005. Summarise the information by selecting and reporting the main features, and make comparisons where relevant.

The chart illustrates the percentage if households owning different categories of technology in different countries in 1995 and 2005 . Overall , it’s clear that the mobile phone and internet access significantly incline more than television and computer between the 2 years in the essay i will explain widely about this chart . In 1995 […]

See All
We have detected unusual activity on your device.
Please verify your identity to continue.
Note: This verification step won't sign you in. If you have a premium account, please log in to access the service as usual.
Google/Gmail Verification
Or verify using Email/Code
We've sent a verification code to:
youremail@gmail.com (Not your email?)
Enter it below to complete the verification process.
Ensure your email address is correct, your inbox is not full, and you check your spam folder. If no email arrives, consider using an alternative email.
You will need a Premium plan to perform your action!
Note: If you already have a premium account, please log in to access our services as usual.

Plans & Pricing

Our mission is to make quality education accessible for everyone.
However, to keep our hardworking team running and this service alive, we genuinely need your support!
By opting for a premium plan, not only do you sustain us in achieving the mission, but you also unlock advanced features to enrich your learning experience.

Free

For learners who aren't pressed for time

What's included on Free
100+ Cambridge IELTS Tests
Instant IELTS Writing Task 1 & 2 Evaluation (2 times/month)
Instant IELTS Speaking Part 1, 2, & 3 Evaluation (5 times/month)
Instant IELTS Writing Task 1 & 2 Essay Generator (2 times/month)
500+ Dictation & Shadowing Exercises
100+ Pronunciation Exercises
Flashcards
Other Advanced Tools

Premium

For those serious about advancing their English proficiency, and for IELTS candidates aspiring to boost their band score by 1-2 points (especially in writing & speaking) in just 30 days or less

What's included on Premium
Save Your IELTS Test Progress
Unlock All Courses & IELTS Tests
Unlimited AI Conversations
Unlimited AI Writing Enhancement Exercises
Unlimited IELTS Writing Task 1 & 2 Evaluation
Unlimited IELTS Speaking Part 1, 2, & 3 Evaluation
Checked Answers Will Not Be Published
Unlimited IELTS Writing Task 1 & 2 Essay Generator
Unlimited IELTS Speaking Part 1, 2, & 3 Sample Generator
Unlimited Usage Of Advanced Tools
Priority Support within 24h (12-month plan only)

Due to the nature of our service and the provided free trials, payments are non-refundable.
Nếu bạn là người Việt Nam và không có hoặc không muốn trả bằng credit/debit cards, bạn có thể thanh toán bằng phương thức chuyển khoản:


Chọn gói:
419,000₫ 277,000 ₫ cho gói 1 tháng (chỉ 9,233₫/ngày)
1,239,000₫ 597,000 ₫ cho gói 3 tháng (chỉ 6,633₫/ngày)
2,469,000₫ 1,027,000 ₫ cho gói 6 tháng (chỉ 5,706₫/ngày)
4,929,000₫ 1,417,000 ₫ cho gói 12 tháng (chỉ 3,936₫/ngày)


Sau khi chuyển khoản, vui lòng đợi trình duyệt tự động điều hướng bạn trở lại Engnovate và bạn sẽ ngay lập tức nhận được mã kích hoạt tài khoản premium.
Nếu có lỗi xảy ra, bạn có thể liên hệ với team thông qua một trong các phương thức: email đến helloengnovate@gmail.com hoặc nhắn tin qua facebook.com/engnovate.
Vì toàn bộ công cụ trên website đều có thể sử dụng thử miễn phí, Engnovate không hỗ trợ hoàn tiền.