Our system will evaluate the answer based on this AI-generated description.
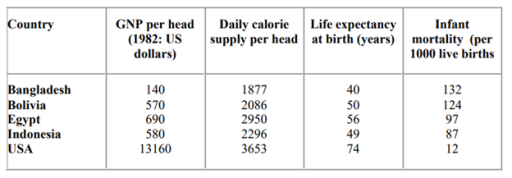
The image depicts a table comparing five countries - Bangladesh, Bolivia, Egypt, Indonesia, and the USA - across four categories: GNP per head in the 1982 US dollars, daily calorie supply per head, life expectancy at birth (years), and infant mortality per 1000 live births. Bangladesh's GNP per head is the lowest at 140, with a daily calorie supply of 1877, a life expectancy of 40 years, and the highest infant mortality rate of 132. Bolivia has a GNP per head of 570, a daily calorie supply of 2086, a life expectancy of 50, and an infant mortality rate of 124. Egypt's GNP per head is 690, with a daily calorie supply of 2950, a life expectancy of 56, and an infant mortality rate of 97. Indonesia has a GNP per head of 580, a daily calorie supply of 2296, a life expectancy of 49, and an infant mortality rate of 87. USA has the highest GNP per head at 13,160, the highest daily calorie supply at 3653, a life expectancy of 74, and the lowest infant mortality rate at 12.
Given the complexity of the image, the above description may not be entirely accurate.
Skyrocket your IELTS band score by 1-2 points in under a month with our premium plan!
Note: Both the topic and the answer were created by one of our users.
The table given depicts data connected to the standard of living in 5 countries, illustrating information for four economic and sociological aspects, with the figures dating from 1982. It is immediately apparent that a correlation was present between the gross national product per capita and the individual’s overall well-being and additionally, the USA chiefly outmatched all other surveyed countries.
The United States of America showed the highest GNP and had the impressive 13,160 USD per citizen. Moreover, the daily food intake per American (3653 calories) was around 700 calories higher compared to the second-best fed nation among the list. Furthermore, their mean life longevity of 74 years was almost three halves of the next highest, while, conversely, infant mortality stayed incredibly low at 1.2%.
Egypt, Indonesia and Bolivia followed the USA in average produced wealth. They showed similar data in all categories; however, the Egyptian’s daily menu (2950 cal.) had significantly more calories than the other two mentioned countries (2296 cal., 2086 cal.). They shared likewise life expectancy (56, 49, 50 respectively) and high infant mortality rates (9.7%, 8.7%, 12.4%). Bangladesh was the poorest nation in the table and had the worst quality of life.
Word Count: 195