Our system will evaluate the answer based on this AI-generated description.
The image shows a line graph titled 'Fish and Meat consumption' with the x-axis labeled with years from 1979 to 2004 in 5-year intervals and the y-axis labeled with 'Grams per person per week' starting from 0 to 300 in 50-gram increments. Four lines represent different types of meat: Fish (solid line), Lamb (dashed line), Beef (solid line), and Chicken (dashed line). Fish consumption starts at around 60 grams and shows a slight increase over the years, reaching just above 100 grams in 2004. Lamb consumption starts at approximately 150 grams, decreases steeply to around 75 grams by 1989, then levels off and fluctuates slightly. Beef consumption begins at 250 grams, declines steadily to almost 150 grams by 2004. Chicken consumption starts at nearly 150 grams, remains stable until 1989, then rises sharply, surpassing beef by 1999 and reaching just below 250 grams in 2004.
Given the complexity of the image, the above description may not be entirely accurate.
Skyrocket your IELTS band score by 1-2 points in under a month with our premium plan!
Note: Both the topic and the answer were created by one of our users.
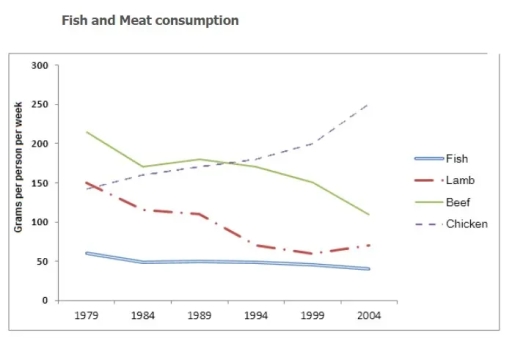
The graph illustrates the amounts of fish and different types of meat which were consumed in a country in Europe from 1978 to 2003.
Overall, what stands out from the graph is that while the consumption rates of beef, lamb and fish fell over the period, the figure for chicken rose significantly within that time.
Focusing on the red meats, beef began the period as the most heavily consumed product studied, with 225 grams eaten per person per week. There was some fluctuation thereafter until 1993, after which it dropped steadily to around 125 grams in 2003. Lamb similarly underwent a decline over the period, falling from 150 grams to about 70 grams over the quarter century.
Chicken and fish, on the other hand, did not experience these significant downwards trends. Although fish consumption did fall during the period, the drop was very slight from 60 to approximately 40 grams. The amount of chicken consumed, in contrast, soared from just under 150 grams in 1979 to below 250 grams in 2003.
Word Count: 171