Our system will evaluate the answer based on this AI-generated description.
The image presents a line graph displaying the quantities of goods transported in the UK between 1974 and 2002 by road, water, rail, and pipeline. In 1974, road transport started at approximately 70 million tonnes, saw a gradual increase peaking at around 100 million tonnes in 1998, and a slight decrease to just below 100 million tonnes by 2002. Water transport began just above 40 million tonnes, fluctuated with a peak at approximately 60 million tonnes in 1994, and ended around 58 million tonnes in 2002. Rail transport started at roughly 40 million tonnes, dipped to about 30 million tonnes by 1982, and then had a steady growth to peak at approximately 42 million tonnes in 2002. Pipeline transport had the least amount in 1974 at around 5 million tonnes, then showed a sharp increase reaching about 20 million tonnes by 1978, followed by a steady growth to nearly 25 million tonnes in 2002.
Given the complexity of the image, the above description may not be entirely accurate.
Skyrocket your IELTS band score by 1-2 points in under a month with our premium plan!
Note: Both the topic and the answer were created by one of our users.
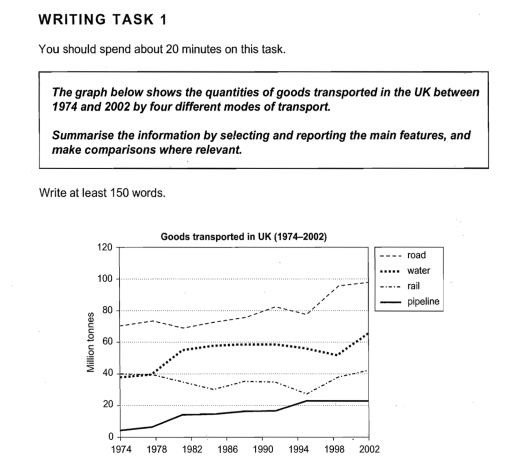
The line graph illustrates the amounts of goods transported in the UK from 1974 to 2002. The data is divided different four categories(road, water, rail, pipeline) of transport. From an overall perspective, it is evident that road was the highest million tonnes, while the pipeline was the lowest.
In detail, the notable option was road. The road accounted for around 70 million in 1974 and it was maintain approximately 70 to 80 million until 1994. It rapidly increase around 78 to 99 million between 1994 and 2002. The water and rail same made up 40 million from 1974 to 1978. In 1982, the water was rose trend, however the rail lead to decline. The water reached around 60 million and it fell around 50 million in 1998. In 2002, it again increased approximately 62 million.
Conversely, the rail accounted for 30 million from 1978 to 1994. Finally it increased until 41 million in 2002. The pipeline was slightly rose trend between 1974 and 2002. It made up 22 million in 2002.
Word Count: 171