Our system will evaluate the answer based on this AI-generated description.
The image presents a line graph displaying the quantities of goods transported in the UK between 1974 and 2002 by road, water, rail, and pipeline. In 1974, road transport started at approximately 70 million tonnes, saw a gradual increase peaking at around 100 million tonnes in 1998, and a slight decrease to just below 100 million tonnes by 2002. Water transport began just above 40 million tonnes, fluctuated with a peak at approximately 60 million tonnes in 1994, and ended around 58 million tonnes in 2002. Rail transport started at roughly 40 million tonnes, dipped to about 30 million tonnes by 1982, and then had a steady growth to peak at approximately 42 million tonnes in 2002. Pipeline transport had the least amount in 1974 at around 5 million tonnes, then showed a sharp increase reaching about 20 million tonnes by 1978, followed by a steady growth to nearly 25 million tonnes in 2002.
Given the complexity of the image, the above description may not be entirely accurate.
Skyrocket your IELTS band score by 1-2 points in under a month with our premium plan!
Note: Both the topic and the answer were created by one of our users.
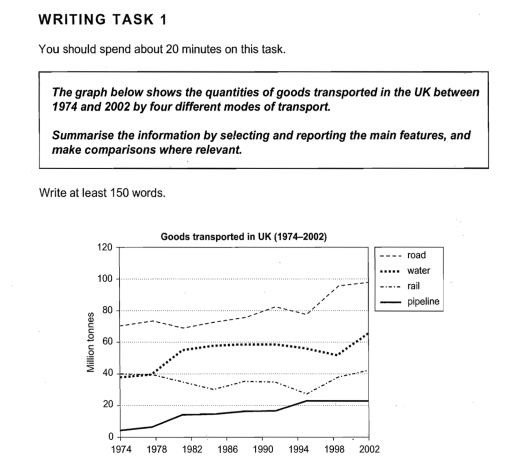
The line graph illustrates the amount of goods transported in the UK by four different modes of transport road, water, rail, and pipeline between the years 1974 and 2002.
As shown in the graph, it provides data about how goods were moved using different transportation methods during that period. Each mode shows a different trend in terms of quantity transported.
In 1974, road transport accounted for the highest volume of goods, starting at around 70 million tonnes and increasing steadily to nearly 98 million tonnes by 2002. Water transport also showed a general upward trend, rising from about 40 million tonnes to over 60 million tonnes. Meanwhile, rail transport remained relatively stable, with some fluctuations, starting at around 40 million tonnes and ending just slightly higher. In contrast, pipeline transport started at about 5 million tonnes in 1974 and increased slowly, reaching around 20 million tonnes in 2002.
Overall, road transport was consistently the most commonly used method throughout the period, while pipeline remained the least used. The graph shows a clear difference between each mode, with road and water increasing steadily, and rail and pipeline showing more limited or stable changes.
Word Count: 192