Our system will evaluate the answer based on this AI-generated description.
The image contains a line graph showing Twitter use by age group over 8 time points: 10/11, 11/01, 11/05, 11/08, 12/02, 12/08, 12/12, 13/05. Age groups are represented as 18-29, 30-49, 50-64, 65+. At 10/11, 18-29 usage is around 30%, 30-49 around 15%, 50-64 around 5%, 65+ just under 5%. At 11/01, 18-29 increases to just under 35%, 30-49 to just above 15%, 50-64 and 65+ remain steady. At 11/05, 18-29 drops to just above 30%, 30-49 rises to 20%, 50-64 to almost 10%, 65+ to almost 5%. At 11/08, 18-29 rises to just under 35%, 30-49 to just over 20%, 50-64 to just over 10%, 65+ to just over 5%. At 12/02, 18-29 drops to 30%, 30-49 drops to 15%, 50-64 rises to 12.5%, 65+ drops to 5%. At 12/08, 18-29 rises to almost 35%, 30-49 rises to 20%, 50-64 to almost 15%, 65+ to just over 5%. At 12/12, 18-29 drops to just above 30%, 30-49 drops to just over 15%, 50-64 rises to 15%, 65+ to just under 5%. At 13/05, 18-29 rises to just below 35%, 30-49 to just over 20%, 50-64 to just under 15%, 65+ remains steady.
Given the complexity of the image, the above description may not be entirely accurate.
Skyrocket your IELTS band score by 1-2 points in under a month with our premium plan!
Note: Both the topic and the answer were created by one of our users.
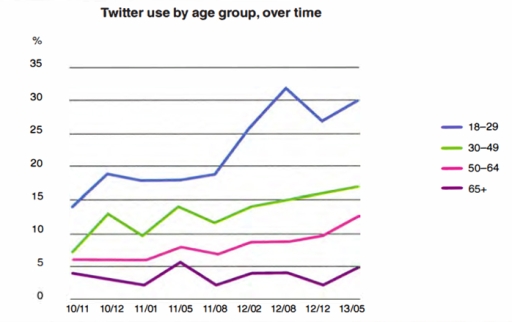
The graph illustrates the share of using Twitter among the several age groups in the USA between November 2010 and May 2013.overall,it can clearly be seen that while,the most significant share in using Twitter belongs to the 18-29 years old people,there is a smooth raise for users with more than 65 years old.
As regard to the graph , the proportion of 18-29 years old group experienced increase more than towfold from approximately 14% in 2010 to 30% in 2013,with reaching a giant leap in the middle of 2012.by contrast,there was an erratic trend for over 65 years in the first of period and then remained flat for some months,finally increased from 4% to 5% in 2010 and 2013 ,respectively.
The Twitter use among 30-49 years old fluctuated at first between 2010 to 2011 and then rose smoothly from almost 13% in the end of 2011 to 17% in 2013.moreover,there were some noticeable fluctuations for users with 50-64 years old with having a total upward trend from approximately 5% in 2010 compared to 13% at the end of period.
Word Count: 179