Our system will evaluate the answer based on this AI-generated description.
The image presents two line graphs detailing monthly visits to the UK in millions. The first graph, titled "Holiday visits to UK (million)", shows data from France and North America. For France, the monthly visit figures are: Jan 0.9, Feb 1.0, Mar 1.1, Apr 1.2, May 1.3, Jun 1.4, Jul 1.5, Aug 1.4, Sep 1.3, Oct 1.2, Nov 1.0, and Dec 0.9. For North America, the figures are: Jan 0.8, Feb 1.2, Mar 1.6, Apr 2.0, May 2.3, Jun 2.7, Jul 3.0, Aug 2.7, Sep 2.3, Oct 1.8, Nov 1.3, and Dec 0.7. The second graph, "Business visits to UK (million)", displays monthly data for the same regions. For France, the figures are: Jan 0.05, Feb 0.10, Mar 0.15, Apr 0.18, May 0.20, Jun 0.15, Jul 0.12, Aug 0.10, Sep 0.15, Oct 0.20, Nov 0.15, and Dec 0.10. For North America, the figures are: Jan 0.15, Feb 0.20, Mar 0.25, Apr 0.28, May 0.30, Jun 0.25, Jul 0.22, Aug 0.20, Sep 0.28, Oct 0.35, Nov 0.30, and Dec 0.25.
Given the complexity of the image, the above description may not be entirely accurate.
Skyrocket your IELTS band score by 1-2 points in under a month with our premium plan!
Note: Both the topic and the answer were created by one of our users.
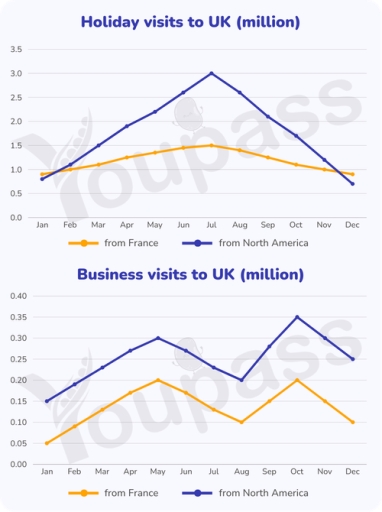
The two line graphs illustrate the annual number of trips from France and North America to the UK for both holiday and business purposes.
Overall, it is evident that visitors from both regions followed similar seasonal patterns. Notably, July stands out as the busiest month for holidaymakers, whereas October is the most popular time for business travel.
Regarding holiday visits, the number of travelers from North America surged from a mere 0.8 million in January to a peak of 3 million in July, before plummeting to 0.6 million in December. France followed a similar trajectory; however, the volume of travelers was significantly lower, reaching only half the level of North America at its peak.
Turning to business travel, both groups experienced significant fluctuations throughout the year. North American business travel dominated the graph, peaking at 0.35 million visits in October. By contrast, the number of business trips from France remained more modest, reaching a peak of 0.15 million in both May and October.
Word Count: 163