Our system will evaluate the answer based on this AI-generated description.
The image shows a line graph of 15 year-olds with low literacy levels from 2000 to 2009 for Austria, Denmark, Ireland, and Sweden. In 2000, Austria started at about 18%, Denmark at 16%, Ireland at 12%, and Sweden at 10%. In 2003, Austria increased to about 19%, Denmark stayed the same, Ireland increased to about 13%, and Sweden increased to about 11%. In 2006, Austria increased dramatically to about 27%, Denmark increased to about 17%, Ireland increased to about 15%, and Sweden increased to about 12%. In 2009, Austria decreased to about 26%, Denmark increased to about 18%, Ireland increased to about 17%, and Sweden increased to about 14%. The y-axis represents the percentage of 15 year-olds with low literacy levels, while the x-axis represents the years. Each country is represented by a different colored line: Austria (blue), Denmark (purple), Ireland (yellow), and Sweden (green).
Given the complexity of the image, the above description may not be entirely accurate.
Skyrocket your IELTS band score by 1-2 points in under a month with our premium plan!
Note: Both the topic and the answer were created by one of our users.
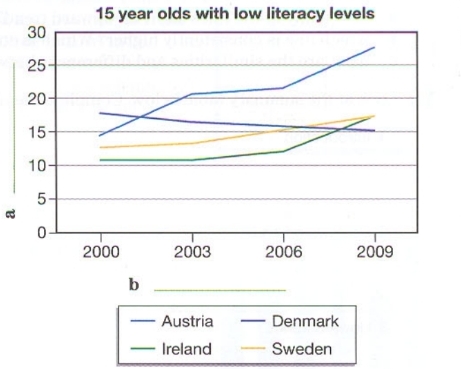
The line graph below provides information about poor literacy level among 15 years old in four countries over the period from 2000 to 2009
Overall, it is obvious that low literacy level has been increased in all countries except one .Austria showed upward trend and had a high poor literacy level except beginning while Ireland and Sweden demonstrated same literacy level at the end of the period. In contract only one Denmark showed downward trend by reducing bad literacy level in country
Denmark initially dominated however thorough the period it faced a rapid change . Low literacy level among teenagers has been fell down. While Austria surpassed all countries on a low literacy level. It’s poor literacy level dramatically escalated. Which by the 2009 peaked of nearly 30%
Ireland and Sweden started with low percentage of bad literacy however thorough the period their proportion of low literacy level has been increased over the period from 2000 to 2009 they gradually increased and by the end of the period they both showed same proportion of low literacy level by reaching around 16%
Word Count: 181