Our system will evaluate the answer based on this AI-generated description.
The image displays a line graph representing population in millions from 1800 to 2010 for five countries. The vertical axis, Population (millions), scales from 0 to 1,600, while the horizontal axis indicates years in 10-year increments. The approximate data points for each country are: China (in millions) 1800:320, 1810:350, 1820:380, 1830:400, 1840:410, 1850:410, 1860:380, 1870:360, 1880:370, 1890:380, 1900:400, 1910:420, 1920:470, 1930:500, 1940:520, 1950:560, 1960:650, 1970:820, 1980:980, 1990:1150, 2000:1280, 2010:1420; India (in millions) 1800:160, 1810:170, 1820:175, 1830:180, 1840:190, 1850:200, 1860:210, 1870:220, 1880:230, 1890:240, 1900:250, 1910:260, 1920:270, 1930:300, 1940:350, 1950:400, 1960:500, 1970:600, 1980:750, 1990:920, 2000:1100, 2010:1350; United States (in millions) 1800:5, 1810:7, 1820:10, 1830:13, 1840:17, 1850:23, 1860:31, 1870:40, 1880:50, 1890:63, 1900:76, 1910:92, 1920:106, 1930:123, 1940:132, 1950:151, 1960:179, 1970:203, 1980:227, 1990:250, 2000:282, 2010:310; Indonesia (in millions) 1800:10, 1810:12, 1820:15, 1830:18, 1840:22, 1850:26, 1860:30, 1870:35, 1880:40, 1890:45, 1900:50, 1910:55, 1920:60, 1930:65, 1940:70, 1950:80, 1960:95, 1970:120, 1980:150, 1990:180, 2000:210, 2010:240; Brazil (in millions) 1800:3, 1810:4, 1820:5, 1830:6, 1840:7, 1850:8, 1860:9, 1870:10, 1880:12, 1890:15, 1900:18, 1910:22, 1920:27, 1930:34, 1940:41, 1950:54, 1960:72, 1970:96, 1980:121, 1990:150, 2000:175, 2010:200.
Given the complexity of the image, the above description may not be entirely accurate.
Skyrocket your IELTS band score by 1-2 points in under a month with our premium plan!
Note: Both the topic and the answer were created by one of our users.
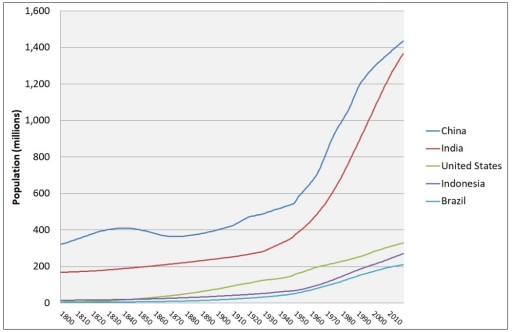
The line graph illustrates how the populations of 5 countries (China, India, the United States, Indonesia and Brazil) have changed over a 220 year period, from 1800 to 2020.
Overall, all countries have experienced a rise in population, though the change has been the most dramatic for China and India.
Looking first at the data for China and India, the former had a population of just over 300 million in 1800. This figure slowly fluctuated at around 400 million up to 1900. From 1900 to 1950 China’s population then gradually increased to 550 million. At this stage, there was a dramatic growth that saw the number reach 1.44 billion in 2020. Although India began the period with a lower population (at 180 million people), this number slowly rose to almost 300 million in 1930 before rocketing to 1.38 billion people in 2020.
In contrast, the other three countries’ populations rose more gradually. The number of people living in the USA began noticeably growing in 1860, from around 50 million to approximately 130 million by 1940. This growth accelerated to over 300 million by 2020. Indonesia and Brazil had lower populations and both followed a similar trend, seeing their populations begin to rise dramatically in 1960 from under 100 million to around 280 million and 210 million, respectively.
Word Count: 217
