🔥 Today Only: Save 30% on Premium — Offer Ends Soon! - Upgrade Now!
Map

Band 5+: The map below shows the changes in an American town between 1954 and 2014. Summarise the information by selecting and reporting the main features, and make comparisons where relevant.

Image for topic: The map below shows the changes in an American town between 1954 and 2014. Summarise the information by selecting and reporting the main features, and make comparisons where relevant.
Our system will evaluate the answer based on this AI-generated description.
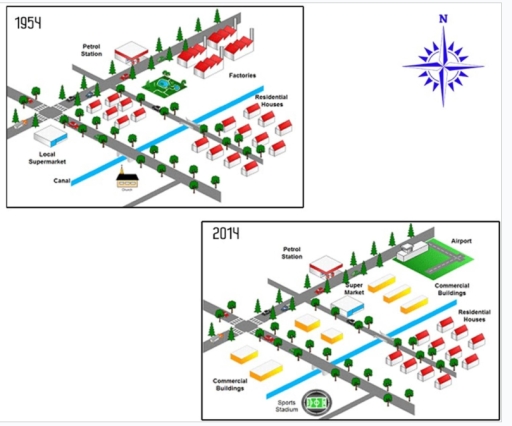
The image presents two isometric maps comparing urban layouts for the years 1954 and 2014. In the 1954 map: there are multiple residential houses arranged in rows, a petrol station located near the lower left, one local supermarket adjacent to the petrol station, a canal running horizontally near the lower side, and three blocks of factories behind the residential houses. In the 2014 map: the setup includes several residential houses, a petrol station retained in the same position, a larger supermarket labeled "Super Market," expanded commercial buildings spread across the middle of the setup, a new sports stadium named "Sports Stadium" toward the lower right, and an airport located at the upper right. The layouts also showed an increased road network in 2014. No specific numerical data or percentages about sizes, number of buildings, or population data are provided in the image.
Given the complexity of the image, the above description may not be entirely accurate.
Note: Both the topic and the answer were created by one of our users.

The maps illustrates an American town, before and after it was developed between 1954 and 2014.

In 1954, the town was most with residential houses, over the period the town was completely transformed with addition of commercial buildings, airport, and a sports stadium; However, the south-east part is remain untouched.

In 1954, the north-east part of the town was occupied with factories, in 2014 the factories was replaced with the airport and commercial buildings. The local super market is removed and relocated to other side of the road to the north side of the town. In the place of the local super market the commercial buildings were developed in 2014. In the middle of the town residential houses were demolished and replaced with commercial buildings.

Additionally, the church is converted into a sports stadium. The petrol stations remained constant over the period. Like wise, south-east residential houses were untouched throughout the period.

Word Count: 152

Answers On The Same Topic:

The map below shows the changes in an American town between 1954 and 2014. Summarise the information by selecting and reporting the main features, and make comparisons where relevant.

The maps illustrate how a town has been developed since 1948, focussing expansion on commercial areas, infrastructure, and land use. In 1948, there were three roads: the largest one ran diagonally, southwest to northeast, while two paralel roads to transverse northwest to southeast. Residential houses were mainly in the southeast, surrounded by the two main […]

The map below shows the changes in an American town between 1954 and 2014. Summarise the information by selecting and reporting the main features, and make comparisons where relevant.

The following images give information on the alterations that took place in a town in the USA from 1954 to 2014. Overall, it is clear from the illustrations that the town witnessed dramatic changes. The most important changes are that an airport and many commercial buildings were constructed. To begin, one of the most striking […]

The map below shows the changes in an American town between 1954 and 2014. Summarise the information by selecting and reporting the main features, and make comparisons where relevant.

The two maps illustrate the differences in one American town over a period from 1954 to 2014. Overall, it is noteworthy that the area became more commercial than industrial. They relocated the supermarket and developed a commercial center instead. The park and factories were removed and substituted by a supermarket, commercial buildings and an airport, […]

The map below shows the changes in an American town between 1954 and 2014. Summarise the information by selecting and reporting the main features, and make comparisons where relevant.

These maps shows the changes that occur in an American town between 1954 to 2014. There are several changes in the town. In 1954, there are factories on the uper left side of the town but now, the factories are removed and an airport is built up there. The petrol station is at the same […]

The map below shows the changes in an American town between 1954 and 2014. Summarise the information by selecting and reporting the main features, and make comparisons where relevant.

The maps illustrate the alterations that have been made in an American town over the period of 60 years. Overall, it is evident that the town has transformed considerably from residential to a commercial area throughout the whole period. The most striking changes are the appearance of commercial buildings, construction of the airport and sports […]

See All

Other Topics:

Th emaps show the changes of Frenton town over the 22 years.

The plans show the changes that took place in Frenton in the oeriod between 1990 and 2012. Overall, the modification that happened in the urben area mostly were: an expension procuders to sertain buildings to insure their efficiency, or conversion processes to some buildings’ activity. The old map shows that a main road callede high […]

The diagram below shows the changes, which took place in a coastal area called Pentland from 1950 to 2007. Write a report for a university lecturer describing the diagrams below.

The maps illustrate how a coastal area, namely Pentland, developed from 1950 to 2007. Overall, Pentland urbanized to be a residential area, with the addition of communal amenities. It is also worth noting that the coastal town developed more roads with the reduction of grassland and industrial area. In the northwest of Pentland, the area […]

The two maps show an island before and after the constructions of some tourist facilities

The diagrams illustrate island’s look before and after adjustments for tourists. Overall, there was nothing on the island, but a beach as well as trees. After the improvements, a lot of tourist facilities were added. Notably, pier also was added so as to access to the land. In the center of the southern part by […]

The two maps show an island before and after the constructions of some tourist facilities

The diagrams illustrate island’s look before and after adjustments for tourists. Overall, there were nothing on the island, but beach as well as trees. After the improvements, a lot of touristic facilities was added. Notably, pier also was added so as to access to the land. In the center of the southern part by the […]

The maps below illustrates how Frenton changed from 1990 to 2012

The two maps illustrate the changes that took place in Freton between the year 1990 and 2012. Overall, while the school, library and hospital remained unchanged, all the remaining infrastructure underwent significant changes. Additionally, these changes show that the town became more modern in order to meet the needs of society. From 1990 to 2012, […]

The diagrams below show the plan of a small school in 1980 and in 2010.

The two maps show the changes that took place on the ground floor of a university department between 1980 and 2010. Overall, it is clear that the department became much bigger over this period. The trees and plants that were there in 1980 were removed, and new facilities such as a car park and an […]

See All
We have detected unusual activity on your device.
Please verify your identity to continue.
Note: This verification step won't sign you in. If you have a premium account, please log in to access the service as usual.
Google/Gmail Verification
Or verify using Email/Code
We've sent a verification code to:
youremail@gmail.com (Not your email?)
Enter it below to complete the verification process.
Ensure your email address is correct, your inbox is not full, and you check your spam folder. If no email arrives, consider using an alternative email.
You will need a Premium plan to perform your action!
Note: If you already have a premium account, please log in to access our services as usual.

Plans & Pricing

Our mission is to make quality education accessible for everyone.
However, to keep our hardworking team running and this service alive, we genuinely need your support!
By opting for a premium plan, not only do you sustain us in achieving the mission, but you also unlock advanced features to enrich your learning experience.

Free

For learners who aren't pressed for time

What's included on Free
100+ Cambridge IELTS Tests
Instant IELTS Writing Task 1 & 2 Evaluation (2 times/month)
Instant IELTS Speaking Part 1, 2, & 3 Evaluation (5 times/month)
Instant IELTS Writing Task 1 & 2 Essay Generator (2 times/month)
500+ Dictation & Shadowing Exercises
100+ Pronunciation Exercises
Flashcards
Other Advanced Tools

Premium

For those serious about advancing their English proficiency, and for IELTS candidates aspiring to boost their band score by 1-2 points (especially in writing & speaking) in just 30 days or less

What's included on Premium
Save Your IELTS Test Progress
Unlock All Courses & IELTS Tests
Unlimited AI Conversations
Unlimited AI Writing Enhancement Exercises
Unlimited IELTS Writing Task 1 & 2 Evaluation
Unlimited IELTS Speaking Part 1, 2, & 3 Evaluation
Checked Answers Will Not Be Published
Unlimited IELTS Writing Task 1 & 2 Essay Generator
Unlimited IELTS Speaking Part 1, 2, & 3 Sample Generator
Unlimited Usage Of Advanced Tools
Priority Support within 24h (12-month plan only)

Due to the nature of our service and the provided free trials, payments are non-refundable.
Nếu bạn là người Việt Nam và không có hoặc không muốn trả bằng credit/debit cards, bạn có thể thanh toán bằng phương thức chuyển khoản:


Chọn gói:
419,000₫ 277,000 ₫ cho gói 1 tháng (chỉ 9,233₫/ngày)
1,239,000₫ 597,000 ₫ cho gói 3 tháng (chỉ 6,633₫/ngày)
2,469,000₫ 1,027,000 ₫ cho gói 6 tháng (chỉ 5,706₫/ngày)
4,929,000₫ 1,417,000 ₫ cho gói 12 tháng (chỉ 3,936₫/ngày)


Sau khi chuyển khoản, vui lòng đợi trình duyệt tự động điều hướng bạn trở lại Engnovate và bạn sẽ ngay lập tức nhận được mã kích hoạt tài khoản premium.
Nếu có lỗi xảy ra, bạn có thể liên hệ với team thông qua một trong các phương thức: email đến helloengnovate@gmail.com hoặc nhắn tin qua facebook.com/engnovate.
Vì toàn bộ công cụ trên website đều có thể sử dụng thử miễn phí, Engnovate không hỗ trợ hoàn tiền.