🔥 Today Only: Save 30% on Premium — Offer Ends Soon! - Upgrade Now!
Map

Band 6+: The maps below shows a plan of a city in 1950 and at the present. Summarise the information by selecting and reporting the main features, and make comparisons where relevant.

Image for topic: The maps below shows a plan of a city in 1950 and at the present. Summarise the information by selecting and reporting the main features, and make comparisons where relevant.
Our system will evaluate the answer based on this AI-generated description.
The image consists of two maps illustrating the same city at two different time periods labeled "City 1950 - population 20,000" and "City now - population 200,000". In the 1950 map, the city shows a river running horizontally with a bridge, a business district at the center, residential area spread around it, one major road bisecting the city vertically, and an airport located to the northeast of the city. The current map displays significant expansion with the business district occupying a larger central area, residential areas surrounding it, and two government buildings located in the north and south. The river now features a dam, and there are two lakes within the city limits. The major road network has increased in density, with one still running vertically through the center, and there is a bridge crossing the river. The airport remains in the same location to the northeast.
Given the complexity of the image, the above description may not be entirely accurate.
Note: Both the topic and the answer were created by one of our users.

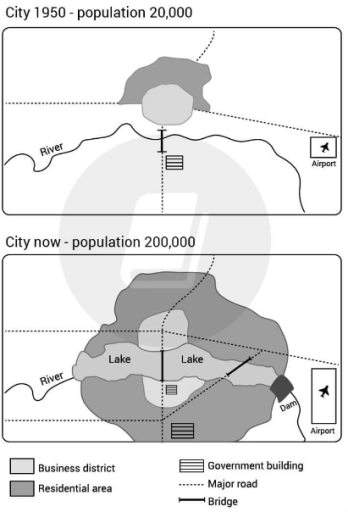
The given maps depict how a city has changed from 1950 to now.

In general, it appears that the population now is more than it was in the past, so a variety of major roads have been added, many business districts, airports have been lengthened, and residential areas have been expanded. In addition to this, the city now has two lakes through business districts and residential areas.

One interesting change is that the city’s population has been raised from 20,000 in 1950 to 200,000 now, so the major roads have been expanded from 3 roads to 5 roads, the business districts have been lengthened being near the main road at the bottom of the map. Also government buildings are increased from one building being next to the bridge to two buildings: smaller ones in the old position and bigger ones at the centre bottom of the map.

Beside this, there has been two lakes through the residential areas and the business districts being separated by the bridge. The residential areas also witnessed a stark increase in the number of areas expanding from the east to the west of the lake. Furthermore, the airport now is lengthened from a smaller to a bigger at the east bottom of the after picture.

Word Count: 210

Answers On The Same Topic:

The maps below shows a plan of a city in 1950 and at the present. Summarise the information by selecting and reporting the main features, and make comparisons where relevant.

These two maps show the population number as well as the landscape of the city in comparison of 1950 and the present day. The most critical area being changed is the population is significantly increased 10 times with the figure 20,000 in 1950 to 200,000 now. Accordingly, residential area is almost tenfold increased. A similar […]

The maps below shows a plan of a city in 1950 and at the present. Summarise the information by selecting and reporting the main features, and make comparisons where relevant.

The illustration depicts the layout of a city in 1950 and the present. Overall, there are several changes taken place in the city, including the construction of a new major road and two government buildings, the extension of residential areas, as well as changes made to some natural features. Additionally, with the development of the […]

The maps below shows a plan of a city in 1950 and at the present. Summarise the information by selecting and reporting the main features, and make comparisons where relevant.

The given maps depict how a city has changed from 1950 to the present In general, it appears that the population now is greater than it was in the past, so a variety of major roads have been added, many business districts, airports have been lengthened, and residential areas have been expanded. In addition to […]

The maps below shows a plan of a city in 1950 and at the present. Summarise the information by selecting and reporting the main features, and make comparisons where relevant.

The two maps illustrate the degree to which a city has changed since 1950. Overall, the city has undergone a number of substantial changes, the most important of which are the expansion of the city landscape and the construction of new infrastructure facilities. In 1950, there were just 20,000 inhabitants in the city, with a […]

See All

Other Topics:

The maps below show the layout of a bookshop before and after it was redeveloped.

The given map illustrates the layout of a bookstore in 2000 and how it has been updated. Overall, it can be seen that significant changes have occurred on the northern side of the shop. Moreover, the fiction section has been changed to non-fiction and has become larger. In 2000,the shop had all the necessities but […]

The maps below show the layout of a bookshop before and after it was redeveloped.

The given map illustrates the layout of book store in 2000 to nowadays it was updated . Overall,it can be seen that the significant changing has happened at the Nothern side of shop.Moreover the fiction is changed to non-fiction and has became larger. In 2000 the shop had every necesseraties but not advanced.When you enter […]

The map below illustrates an active mining area before and after a redevelopment plan that transformed it into a tourist attraction. The given map illustrates an active mining are

The image illustrates a coal mining site before and after redevelopment. Overall, the elimination of office, staff changing room, medical room, lorry park and waste tips created space for the introduction of museum, cafe, souvenir shop, footpath, digger driving track, picnik area, and children’s play area during the period. Additionally, the remaining areas – car […]

the following plans show recent archaeological findings at a historic site in the year 2004 and 2014

The two maps illustrate the archaeological findings at a historic site in 2004 and 2014. Overall, the site became considerably more developed, with a wider range of structures distributed across different areas, while some natural features were reduced. Focusing on the northern part of the site, in 2004 there were only a few ancient houses […]

The charts show how an office looks like at present and its future development plan.

The maps shows the look of an office now and how it is expected to look like in the future. Overall, in the future, there will be less facilities, like kitchen. However, there also will be more of outdoor facilities, such as but more of the Currently, a reception desk is opposite the entrance, which […]

the maps show changes in İstanbul in 2000 and today.

The maps illustrate renovations in İstanbul City Library between 2000 and today. Overall, the changes can be divided into 3 categories which are replacements, non-changements and additions. Moreover, the library has developed cafe opportunities over years. In 2000, fiction genre books covered most of the place in the city library. By the present day, art, […]

See All
We have detected unusual activity on your device.
Please verify your identity to continue.
Note: This verification step won't sign you in. If you have a premium account, please log in to access the service as usual.
Google/Gmail Verification
Or verify using Email/Code
We've sent a verification code to:
youremail@gmail.com (Not your email?)
Enter it below to complete the verification process.
Ensure your email address is correct, your inbox is not full, and you check your spam folder. If no email arrives, consider using an alternative email.
You will need a Premium plan to perform your action!
Note: If you already have a premium account, please log in to access our services as usual.

Plans & Pricing

Our mission is to make quality education accessible for everyone.
However, to keep our hardworking team running and this service alive, we genuinely need your support!
By opting for a premium plan, not only do you sustain us in achieving the mission, but you also unlock advanced features to enrich your learning experience.

Free

For learners who aren't pressed for time

What's included on Free
100+ Cambridge IELTS Tests
Instant IELTS Writing Task 1 & 2 Evaluation (2 times/month)
Instant IELTS Speaking Part 1, 2, & 3 Evaluation (5 times/month)
Instant IELTS Writing Task 1 & 2 Essay Generator (2 times/month)
500+ Dictation & Shadowing Exercises
100+ Pronunciation Exercises
Flashcards
Other Advanced Tools

Premium

For those serious about advancing their English proficiency, and for IELTS candidates aspiring to boost their band score by 1-2 points (especially in writing & speaking) in just 30 days or less

What's included on Premium
Save Your IELTS Test Progress
Unlock All Courses & IELTS Tests
Unlimited AI Conversations
Unlimited AI Writing Enhancement Exercises
Unlimited IELTS Writing Task 1 & 2 Evaluation
Unlimited IELTS Speaking Part 1, 2, & 3 Evaluation
Checked Answers Will Not Be Published
Unlimited IELTS Writing Task 1 & 2 Essay Generator
Unlimited IELTS Speaking Part 1, 2, & 3 Sample Generator
Unlimited Usage Of Advanced Tools
Priority Support within 24h (12-month plan only)

Due to the nature of our service and the provided free trials, payments are non-refundable.
Nếu bạn là người Việt Nam và không có hoặc không muốn trả bằng credit/debit cards, bạn có thể thanh toán bằng phương thức chuyển khoản:


Chọn gói:
419,000₫ 277,000 ₫ cho gói 1 tháng (chỉ 9,233₫/ngày)
1,239,000₫ 597,000 ₫ cho gói 3 tháng (chỉ 6,633₫/ngày)
2,469,000₫ 1,027,000 ₫ cho gói 6 tháng (chỉ 5,706₫/ngày)
4,929,000₫ 1,417,000 ₫ cho gói 12 tháng (chỉ 3,936₫/ngày)


Sau khi chuyển khoản, vui lòng đợi trình duyệt tự động điều hướng bạn trở lại Engnovate và bạn sẽ ngay lập tức nhận được mã kích hoạt tài khoản premium.
Nếu có lỗi xảy ra, bạn có thể liên hệ với team thông qua một trong các phương thức: email đến helloengnovate@gmail.com hoặc nhắn tin qua facebook.com/engnovate.
Vì toàn bộ công cụ trên website đều có thể sử dụng thử miễn phí, Engnovate không hỗ trợ hoàn tiền.