Our system will evaluate the answer based on this AI-generated description.
The image contains a table with data from 2005 and 2015 comparing the percentage of children with different educational problems in two primary schools, A and B. Problem areas listed include Reading ability, Handwriting, Spelling, Listening skills, Verbal expression of ideas, Concentration in lessons, and Following instructions. In 2005, School A percentages: Reading ability 22, Handwriting 28, Spelling 30, Listening skills 35, Verbal expression of ideas 35, Concentration in lessons 40, Following instructions 42. School B percentages: Reading ability 8, Handwriting 7, Spelling 5, Listening skills 11, Verbal expression of ideas 14, Concentration in lessons 15, Following instructions 6. In 2015, School A percentages: Reading ability 23, Handwriting 28, Spelling 25, Listening skills 20, Verbal expression of ideas 21, Concentration in lessons 18, Following instructions 18. School B percentages: Reading ability 9, Handwriting 7, Spelling 10, Listening skills 12, Verbal expression of ideas 15, Concentration in lessons 15, Following instructions 12.
Given the complexity of the image, the above description may not be entirely accurate.
Skyrocket your IELTS band score by 1-2 points in under a month with our premium plan!
Note: Both the topic and the answer were created by one of our users.
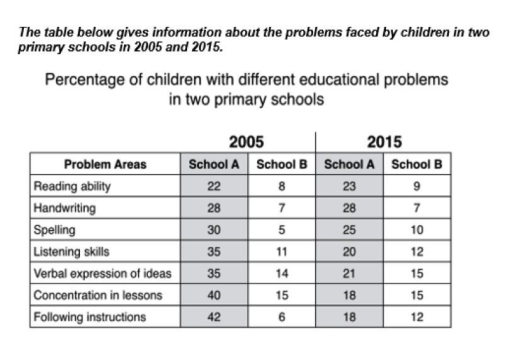
The given table illustrates the percentage of students experiencing various educational problems in two primary schools in 2005 and 2015.
Overall, while the proportion of students with difficulties decreased significantly in School A over the decade, School B witnessed slight increases in several problem areas.
In 2005, the most common issue in School A was following instructions (42%), followed closely by concentration (40%) and listening skills (35%). Other problems such as spelling, handwriting, and verbal expression ranged between 28% and 35%, while reading ability was the least reported (22%). In contrast, figures for School B were much lower, with all percentages below 15%.
By 2015, School A experienced notable reductions in nearly all categories. Following instructions dropped sharply to 18%, while concentration, listening, and verbal expression also declined considerably. Spelling decreased slightly, and reading and handwriting remained unchanged. Meanwhile, School B showed minor increases. The percentage of students having trouble with spelling doubled from 5% to 10%, and those struggling to follow instructions rose from 6% to 12%.
Word Count: 168