🔥 Today Only: Save 30% on Premium — Offer Ends Soon! - Upgrade Now!
Table

Band 5+: The table below shows the number of full-time international students who studied at various universities in Canada in 2019/20 and 2020/21.

Image for topic: The table below shows the number of full-time international students who studied at various universities in Canada in 2019/20 and 2020/21.
Our system will evaluate the answer based on this AI-generated description.
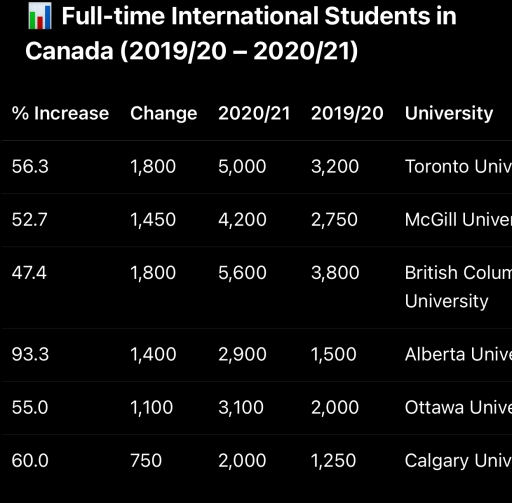
The image displays a table titled 'Full-time International Students in Canada (2019/20 – 2020/21)', which lists data for six universities. For Toronto University, the number of students in 2019/20 was 3,200 and in 2020/21 was 5,000, a change of 1,800, representing a 56.3% increase. For McGill University, the numbers were 2,750 in 2019/20 and 4,200 in 2020/21, a change of 1,450 and a 52.7% increase. For British Columbia University, the count was 3,800 in 2019/20 and 5,600 in 2020/21, a change of 1,800 and a 47.4% increase. For Alberta University, there were 1,500 students in 2019/20 and 2,900 in 2020/21, a change of 1,400 and a 93.3% increase. For Ottawa University, the student count was 2,000 in 2019/20 and 3,100 in 2020/21, a change of 1,100 and a 55.0% increase. For Calgary University, the numbers were 1,250 in 2019/20 and 2,000 in 2020/21, a change of 750 and a 60.0% increase.
Given the complexity of the image, the above description may not be entirely accurate.
Note: Both the topic and the answer were created by one of our users.

The diagram illustrates theamounts of full time international students who educated in a various universities in Canada with calculated statistic from 2019-2020 and 2020-2021 periods. Overall, all universities recorded an increase over the period. The biggest grow was in a Alberta university, while British Council univercity had the lowest upward change.

On the one hand, regarding big shifts, Alberta university estimated highest rise that nearly doubled over 1-year period with 1,400 new students in a educational centre and with total of 2,900 international pupils. Although, Calgary univercity took a second position with 750 that make 60% proportion of new foreign learners and increased the number of students from 1,250 to 2,000. At a trird position – Toronto university with 56,3% jump with 1,800 new trainees.

On the other hand, although , British Council had the highest number of students, but determined lowest switch from 3,800 to to 5,600 that create a 47,4% grow. While Ottawa and McGill universities computed relatively similar patern with 55% and 52,7% rise, respectively.

Word Count: 168

Answers On The Same Topic:

The table below shows the number of full-time international students who studied at various universities in Canada in 2019/20 and 2020/21.

The diagram illustrates the amounts of full-time international students who were educated in various universities in Canada, with calculated statistics from the 2019-2020 and 2020-2021 periods. Overall, all universities recorded an increase over the period. The biggest growth was in an Alberta university, while British Council University had the lowest upward change. On the one […]

The table below shows the number of full-time international students who studied at various universities in Canada in 2019/20 and 2020/21.

The table compares the number of full-time international students in 2019/20 with those of 2020/21 in 6 universities in Canada. Overall, this figure has increased in all of the universities over the period, with the most growth rate recorded for Alberta university. However, by the end of the period British Colum university had the highest […]

The table below shows the number of full-time international students who studied at various universities in Canada in 2019/20 and 2020/21.

The table below provides information about the number of students who are studying at different universties of canada in the time period of 2019/20 and 2020/21. In the toronto university 32,00 pupils are studying in 2919 to 2020 which are about 40% and it experienced a rise in 2020/21 the students are 5,000 in the […]

The table below shows the number of full-time international students who studied at various universities in Canada in 2019/20 and 2020/21.

The table provides information about the number of full-time international student who studied at various universities in Canada during 2019/20 and 2020/21. Overall, all university experienced noticeable increase in the number of students, with British Columbia University showing the largest rise. In 2019/20, British Columbia University had 3,800 students, which grew dramatically to 5,600 in […]

See All

Other Topics:

describing trends and comparing data using a table showing the percentage of household ownership of consumer electronics (smartphones 📱, washing machines 🧺, and desktop computers 🖥️) between the years 2000 and 2020.

The table illustrates the percentage of households in a particular country that owned various consumer durables over the period from 2000 to 2020. Overall, while the proportion of people using smartphone and washing machine increased significantly over the period, desktop computer experienced a consistent decline. In 2000, washing machine accounted for the largest share, at […]

The tables below give information about the sales of cocoa beans and coffee in five European countries in 2000 and 2005. Summarise the information by selecting and reporting the main features, and make comparisons where relevant.

The table iillustrates the revenue of cocoa beans and coffee in in millions, in five different European nation in the years 2000 and 2005. Overall, cocoa bean and coffee sales almost doubled in all five countries. While Britain had the highest sales of cocoa beans and coffee in both 2000 and 2005, Switzerland had the […]

The table below shows the number of vehicles registered in Australia in 2010, 2012 and 2014.

The table illustrates the proportion of vehicles registered in Australia in 2010, 2012, and 2014. Overall, passenger vehicles accounted for the largest share of registrations throughout the period, while motorcycles experienced the most significant growth. By contrast, heavy trucks recorded the lowest growth rate. In 2010, there were 11 million passenger vehicles registered in Australia. […]

The table below shows the number of vehicles registered in Australia in 2010, 2012 and 2014.

The table chart provides information about the proportion of vehicles which were rigistered in Australia in the year 2010,2012, and 2014. Overall, passenger vehicles are mostly used in the country. And motorcycles increasing rate was the most through the period. In 2010, Passenger transport was 11 million and increased by 2 million in the next […]

Task 1: The tables below provide information about the consumption and production of potatoes in five parts of the world in 2006. Summarize the information by selecting and reporting the main features, and make comparisons where relevant. (Table)

The two tables provided illustrates the informations of potato’s consumption and production in five districts of the world in 2006. Overall, it is noteworthy that while the highest figure in consumption was recorded in the Europe, Asia was the owner of the highest production of potatoes. Moreover, the lowest consumption and production of potatoes were […]

Qualifications for English Language Teachers obtained 2007/8 and 2008/9, UK

The table illustrates international student population in UK acquicing pedagogical training in 2007/8 and 2008/9 academic year and percentage of male qualifiers. Overall, in both academic years tefl in female was higher than men, while male qualifiers makes almost a quarter. Cambridge UCLES CELTA and other degrees makes much lower result compared to tefl in […]

See All
We have detected unusual activity on your device.
Please verify your identity to continue.
Note: This verification step won't sign you in. If you have a premium account, please log in to access the service as usual.
Google/Gmail Verification
Or verify using Email/Code
We've sent a verification code to:
youremail@gmail.com (Not your email?)
Enter it below to complete the verification process.
Ensure your email address is correct, your inbox is not full, and you check your spam folder. If no email arrives, consider using an alternative email.
You will need a Premium plan to perform your action!
Note: If you already have a premium account, please log in to access our services as usual.

Plans & Pricing

Our mission is to make quality education accessible for everyone.
However, to keep our hardworking team running and this service alive, we genuinely need your support!
By opting for a premium plan, not only do you sustain us in achieving the mission, but you also unlock advanced features to enrich your learning experience.

Free

For learners who aren't pressed for time

What's included on Free
100+ Cambridge IELTS Tests
Instant IELTS Writing Task 1 & 2 Evaluation (2 times/month)
Instant IELTS Speaking Part 1, 2, & 3 Evaluation (5 times/month)
Instant IELTS Writing Task 1 & 2 Essay Generator (2 times/month)
500+ Dictation & Shadowing Exercises
100+ Pronunciation Exercises
Flashcards
Other Advanced Tools

Premium

For those serious about advancing their English proficiency, and for IELTS candidates aspiring to boost their band score by 1-2 points (especially in writing & speaking) in just 30 days or less

What's included on Premium
Save Your IELTS Test Progress
Unlock All Courses & IELTS Tests
Unlimited AI Conversations
Unlimited AI Writing Enhancement Exercises
Unlimited IELTS Writing Task 1 & 2 Evaluation
Unlimited IELTS Speaking Part 1, 2, & 3 Evaluation
Checked Answers Will Not Be Published
Unlimited IELTS Writing Task 1 & 2 Essay Generator
Unlimited IELTS Speaking Part 1, 2, & 3 Sample Generator
Unlimited Usage Of Advanced Tools
Priority Support within 24h (12-month plan only)

Due to the nature of our service and the provided free trials, payments are non-refundable.
Nếu bạn là người Việt Nam và không có hoặc không muốn trả bằng credit/debit cards, bạn có thể thanh toán bằng phương thức chuyển khoản:


Chọn gói:
419,000₫ 277,000 ₫ cho gói 1 tháng (chỉ 9,233₫/ngày)
1,239,000₫ 597,000 ₫ cho gói 3 tháng (chỉ 6,633₫/ngày)
2,469,000₫ 1,027,000 ₫ cho gói 6 tháng (chỉ 5,706₫/ngày)
4,929,000₫ 1,417,000 ₫ cho gói 12 tháng (chỉ 3,936₫/ngày)


Sau khi chuyển khoản, vui lòng đợi trình duyệt tự động điều hướng bạn trở lại Engnovate và bạn sẽ ngay lập tức nhận được mã kích hoạt tài khoản premium.
Nếu có lỗi xảy ra, bạn có thể liên hệ với team thông qua một trong các phương thức: email đến helloengnovate@gmail.com hoặc nhắn tin qua facebook.com/engnovate.
Vì toàn bộ công cụ trên website đều có thể sử dụng thử miễn phí, Engnovate không hỗ trợ hoàn tiền.