Our system will evaluate the answer based on this AI-generated description.
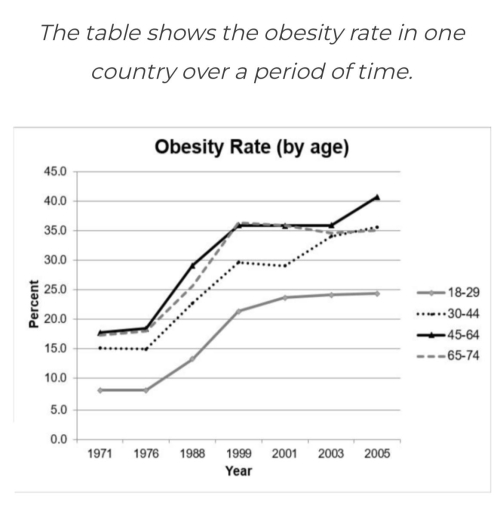
The image exhibits a line graph titled 'Obesity Rate (by age)' with years on the x-axis ranging from 1971 to 2005 and percent on the y-axis from 0 to 45. There are four labeled trend lines: 18-29, 30-44, 45-64, and 65-74. The 18-29 age group starts at approximately 5% in 1971, gradually increasing to 15% in 1988, then to 17.5% in 1999, and reaching just over 17.5% in 2005. The 30-44 age group begins around 12.5% in 1971, escalating to 25% in 1988, surging to just below 35% in 1999, and peaking around 37.5% in 2005. The 45-64 segment initiates at just below 15% in 1971, climbing to just below 30% in 1988, soaring to approximately 37.5% in 1999, and attaining nearly 40% in 2005. Lastly, the 65-74 cohort commences at roughly 12.5% in 1971, advances to just below 20% in 1988, amplifies to just over 20% in 1999, and culminates at 22.5% in 2005.
Given the complexity of the image, the above description may not be entirely accurate.
Skyrocket your IELTS band score by 1-2 points in under a month with our premium plan!
Note: Both the topic and the answer were created by one of our users.
The diagram illustrates the increasing rate of fatness among different age people between 1971 and 2,005 in a country.
Overall, the quantity of our weight has rosen and stabilized throughout the given period, peaking at over 40% between 45-64 ages and having the lowest of points at youth aged 18 to 29. While, the groups at 30-44 and 65-74 had the same percentage of obesity since 2003 year.
In the first year, obesity rates stood at 80% for citizens aged 65 – 74 and 45 – 64, approximately 8% for people aged 18 – 29 and 15% for 30 – 44 ages. For the next 6 years, all numbers remained stable and dramatically doubled by the 1999. Since that, generation of 18 – 29 and 65 – 74 maintained at about 24% and 35% till the end of the period, while people of 30 -44 and 45 – 64 grew considerably. Over 45 age category had no change during 1999 to 2003 and moderately rosen into 5%, reaching about 40% in 2005. However, obesity percent of people aged 30 – 44 leveled off for 3 years at about 30% and had a growth of 5% in 2003, minimally increased to 2% till 2005.
Word Count: 203
