Our system will evaluate the answer based on this AI-generated description.
The image shows two tables comparing people's perceptions of various aspects of living conditions in 1980 and 2010. In 1980, the percentages for "good" are: education (72), healthcare (82), environment (72), shops (64), employment (62), and transport (52). The "neither good nor bad" percentages are: education (23), healthcare (20), environment (22), shops (22), employment (22), and transport (16). The "bad" percentages are: education (5), healthcare (8), environment (6), shops (10), employment (10), and transport (32). In 2010, the "good" percentages are: education (82), healthcare (74), environment (71), shops (60), employment (72), and transport (39). The "neither good nor bad" percentages are: education (11), healthcare (14), environment (13), shops (24), employment (5), and transport (23). The "bad" percentages are: education (9), healthcare (12), environment (16), shops (16), employment (23), and transport (38).
Given the complexity of the image, the above description may not be entirely accurate.
Skyrocket your IELTS band score by 1-2 points in under a month with our premium plan!
Note: Both the topic and the answer were created by one of our users.
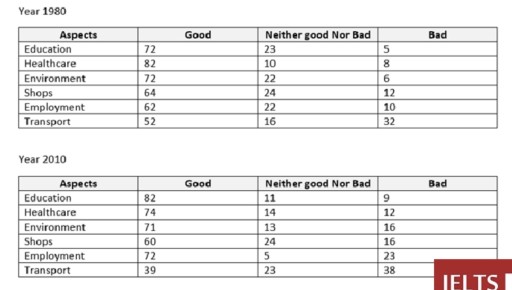
The tables depicts the percentage of feedbacks labelled on different sections of city living in a certain city in 1980 and 2010.
Overall, the satisfaction from residence for aspects in that city outweights the dissatisfaction. Education, healthcare, and environment are areas which receives the best feedback, while transport was the worst.
In 1980, all aspects received more than half good response, with healthcare being the highest at an astonishing 82%. The amount of civilians responding with neutral varied from 10 to 24 percent. In all sections, bad feedback was the lowest, except for transport with an impressive 32%.
In 2010, not all category acquired half good response, with transport only being 39%. There were more awful feedback in 2010 compared to 1980, illustrated by the substantial increase of bad response in environment and employment, both being above 10%. The neutral section is being raced by the bad feedback, shown by the subtle difference in several aspects such as education, healthcare, and environment with only less than a 5% difference.
Word Count: 169