Our system will evaluate the answer based on this AI-generated description.
The image depicts a graph titled "World Meat Production, 1950 - 90" with the y-axis labeled "Million Tons" from 0 to 80, and the x-axis marked with the years 1950, 1960, 1970, 1980, and 1990. Four types of meat are plotted: Pork, Beef/Buffalo, Poultry, and Sheep/Goats. Pork production shows a steady increase from approximately 20 million tons in 1950 to around 70 million tons in 1990. Beef/Buffalo production starts at roughly 10 million tons in 1950 and escalates to near 50 million tons in 1990. Poultry production begins below 10 million tons in 1950, with a sharp climb to just over 30 million tons in 1990. Sheep/Goats production commences at about 5 million tons in 1950 and rises slightly above 10 million tons in 1990. Each data point is connected with lines, with Pork and Beef/Buffalo using solid lines and Poultry and Sheep/Goats using dashed lines.
Given the complexity of the image, the above description may not be entirely accurate.
Skyrocket your IELTS band score by 1-2 points in under a month with our premium plan!
Note: Both the topic and the answer were created by one of our users.
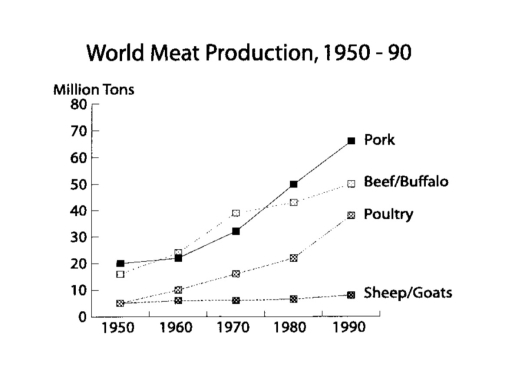
The given line graph highlights the data about the global production of meat in four decades ,starting from 1950 to 1990.
Overall, the proportion of pork beef and poultry showed a moderate upward trend between 1950 and 1990 , whereas the sheep production maintained the same level over the period.
At the beginning of the period, in 1950 the figure for pork was the highest among four types of meat with 20 million tons. 1960 saw a minimal rise to about 22 million tons in the amount of pork producing . In the following three decades, the quantity of manufacturing of pork tripled to around 66 million tons. Meanwhile, there was a gap of 10 million tons between the percentage of Buffalo and poultry producing at about 15 and 5 million tons, respectively, in 1950. These lines showed gradual but significant increase to approximately 50 and 40 million tons from 1960 to 1990.
Turning to details ,the production of goats was as high as the proportion of poultry at around 5 million tons in 1950. In struck contrast the share of sheep remained unchanged throughout 40 years.
Word Count: 187