🔥 Today Only: Save 30% on Premium — Offer Ends Soon! - Upgrade Now!
Table

Band 6+: Which communication skills are essential in your job? (Survey 1997 & 2006)

Image for topic: Which communication skills are essential in your job? (Survey 1997 & 2006)
Our system will evaluate the answer based on this AI-generated description.
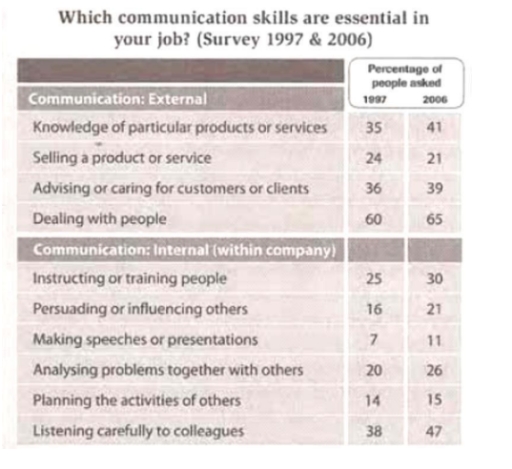
The image contains a table listing various communication skills and the percentage of people who considered them essential for their job based on surveys from 1997 and 2006. Under "Communication: External," results show increases for 'Knowledge of particular products or services' from 35% to 41%, 'Selling a product or service' from 34% to 31%, 'Advising or caring for customers or clients' from 26% to 29%, 'Dealing with people' from 60% to 65%. Under “Communication: Internal (within company),” there's also an increase in percentages for 'Instructing or training people' from 25% to 30%, 'Persuading or influencing others' from 16% to 21%, 'Making speeches or presentations' from 7% to 11%, 'Analysing problems together with others' from 20% to 26%, 'Planning the activities of others' from 14% to 15%, and 'Listening carefully to colleagues' from 38% to 47%.
Given the complexity of the image, the above description may not be entirely accurate.
Note: Both the topic and the answer were created by one of our users.

The chart provides information about the results of two surveys, in 1997 and 2006, in which the public were questioned which communication skills were vital in their employment.

Overall, it can be seen that the highest percentage related to external skills and the lowest proportion shown in internal communication skills in 1997 and 2006. External skills of communication fluctutated in both periods, whereas internal factors increased dramatically during the time.

According to the data, between the years of 1997 and 2006, the employees’ opinion about selling a product or service had fallen considerably comparing to other factors. The percentage solving problems with people has reached a peak, while the survey of making speeches or presentations had the minimum amount in the two years shown.

The proportions of dealing with people, instructing or training individuals and persuading or influencing others had risen significantly for 5 percent. Thus, the percentage of listening carefully to colleagues experienced growth for 9 percent.

Word Count: 158

Answers On The Same Topic:

Which communication skills are essential in your job? (Survey 1997 & 2006)

The table below conveys data about the numbers of two researches that were held in 1997 and 2006 about the importance of communication skills on their jobs. In external way, the highest percentage of workers who found the skill of dealing with people the most importand one in both 1997 and 2006, while selling a […]

Which communication skills are essential in your job? (Survey 1997 & 2006)

The table shows the percentage of people who thought different communication skills were important in their jobs in 1997 and 2006. Overall, skills related to dealing with people were the most important in both years. Most skills became more important in 2006, while only selling a product or service decreased. For external communication, dealing with […]

Which communication skills are essential in your job? (Survey 1997 & 2006)

The provided table illustrates how communication abilities play a crucial role in the workplace over a 9-year period from 1997 to 2006. Overall, it is readily apparent that the perceived importance of forms of communication increased, except for selling a product or service. Additionally, the proportion of dealing with people was considered the most essential […]

Which communication skills are essential in your job? (Survey 1997 & 2006)

The table persents commounication skills are essential in your job. The survey year are 1997 & 2006. Overall, there are two types of communication: external and internal [within company]. There had survey of percentage people who was worked on job over the year. In external, there were four types of coummunication in external. The percentage […]

See All

Other Topics:

the table below shows the result of survey in 2000, 2005 and 2010 about one university

The table displays the proportion of students who gave positive ratings to five different aspects of a university in 2000, 2005 and 2010. Overall, such aspects as teaching quality and electronic resources tended to increase in terms of percentage of students giving good ratings; print resources remained relatively high throughout the period, fluctuating slightly, while […]

The table below shows the production of milk annually in four countries in 1990, 2000 and 2010. Summarize the information by selecting and reporting the main features, and make comparisons where relevant.

The production of milk annually in four nations in the three years 1990, 2000 and 2010 was displayed in the table below. Overall, as can be seen from the table, there was an upward trend for all countries, except for the amount of milk in Australia, where a decrease was witnessed. While the Netherlands consistently […]

The table below shows the consumption of three basic foods (wheat, maize, rice) by people in four different countries.

The table illustrates the daily consumption of three staple foods (wheat, maize, and rice) in four different countries, measured in calories per person. “Overall, it can be seen that each country demonstrates a dominant preference for a specific staple food. Rice is by far the most consumed food in Cambodia, whereas wheat leads in Egypt […]

The table displays trends concerning the amounts of fast food consumed in Melbourne. Summarise the information by selecting and reporting the main features, and make comparisons where relevant You should write at least 150 words.

The given table provides information about five main types of fast food consumed in Melbourne including predictions to 2025. Overall, it is readily apparent from table that hamburger was most preferable choice and it maintains its dominance now, whereas units of noodles consumed by people stayed their lowest position from past to now. In fact, […]

The table shows the two age groups participating in the marathon from 2008 to 2012. Summarize the information by selecting and reporting the main features, and make comparisons where relevant.

The given table demonstrates that the two different age groups participating in the marathon from 2008 to 2012. This table indicates not only age groups, but also total participants over years. Overall, the tendency of participating a marathon was increased regulary. Therefore, the number of age group of 18-39 was always higher than age group […]

The table below compares actual and predicted figures for populations in three different cities.

The table gives data about the actual and predicted residents in three different urban cities-Shanghai, Jakarta and Sao Paulo between 1990 and 2000. Overall, it can be seen that SaoPaulo and Jakarta exhibited a general upward trajectory, while Shanghai showed a slight downward trend. Notably, the prediction of populace among three cities in 1990 and […]

See All
We have detected unusual activity on your device.
Please verify your identity to continue.
Note: This verification step won't sign you in. If you have a premium account, please log in to access the service as usual.
Google/Gmail Verification
Or verify using Email/Code
We've sent a verification code to:
youremail@gmail.com (Not your email?)
Enter it below to complete the verification process.
Ensure your email address is correct, your inbox is not full, and you check your spam folder. If no email arrives, consider using an alternative email.
You will need a Premium plan to perform your action!
Note: If you already have a premium account, please log in to access our services as usual.

Plans & Pricing

Our mission is to make quality education accessible for everyone.
However, to keep our hardworking team running and this service alive, we genuinely need your support!
By opting for a premium plan, not only do you sustain us in achieving the mission, but you also unlock advanced features to enrich your learning experience.

Free

For learners who aren't pressed for time

What's included on Free
100+ Cambridge IELTS Tests
Instant IELTS Writing Task 1 & 2 Evaluation (2 times/month)
Instant IELTS Speaking Part 1, 2, & 3 Evaluation (2 times/month)
Instant IELTS Writing Task 1 & 2 Essay Generator (2 times/month)
500+ Dictation & Shadowing Exercises
100+ Pronunciation Exercises
Flashcards
Other Advanced Tools

Premium

For those serious about advancing their English proficiency, and for IELTS candidates aspiring to boost their band score by 1-2 points (especially in writing & speaking) in just 30 days or less

What's included on Premium
Save Your IELTS Test Progress & Analyze Mistakes By Question Type
Save Your Own Flashcard Sets & Use Them On Any Device
Unlock All Courses, IELTS Tests, Section & Part Practice
Unlimited AI Conversations
Unlimited AI Writing Enhancement Exercises
Unlimited IELTS Writing Task 1 & 2 Evaluation
Unlimited IELTS Speaking Part 1, 2, & 3 Evaluation
Checked Answers Will Not Be Published
Unlimited IELTS Writing Task 1 & 2 Essay Generator
Unlimited IELTS Speaking Part 1, 2, & 3 Sample Generator
Unlimited Usage Of Advanced Tools & AI Features
Priority Support within 24h (12-month plan only)

Due to the nature of our service and the provided free trials, payments are non-refundable.