Our system will evaluate the answer based on this AI-generated description.
The image consists of four line graphs displaying employment data in Australia across three distinct age groups (15-19, 20-24, 25-29, 30-34, 35-39, 40-44, 45-49, 50-54, 55-59, 60-64, 65+) for 1973 and 1993. Full-time male employment in 1973: 60% (15-19), 90% (20-24), 95% (25-29 to 45-49), 92% (50-54), 88% (55-59), 70% (60-64), 20% (65+); in 1993: 50% (15-19), 81% (20-24), 90% (25-29 to 50-54), 80% (55-59), 60% (60-64), 20% (65+). Full-time female employment in 1973: 50% (15-19), 40% (20-24), 35% (25-29), 30% (30-34), 35% (35-39), 40% (40-44), 35% (45-49), 30% (50-54 to 55-59), 10% (60-64), 0% (65+); in 1993: 40% (15-19), 50% (20-24 to 30-34), 55% (35-39), 60% (40-44), 58% (45-49), 50% (50-54 to 55-59), 20% (60-64), 0% (65+). Part-time male employment in 1973: 5% (15-19), 2% (20-24), 1% (25-29 to 35-39), 2% (40-44), 3% (45-49), 4% (50-54), 8% (55-59), 15% (60-64), 20% (65+); in 1993: 8% (15-19), 5% (20-24), 3% (25-29), 4% (30-34), 3% (35-39), 4% (40-44 to 50-54), 5% (55-59), 15% (60-64), 25% (65+). Part-time female employment in 1973: 5% (15-19), 15% (20-24), 12% (25-29), 10% (30-34), 20% (35-39), 25% (40-44), 28% (45-49), 27% (50-54), 22% (55-59), 20% (60-64), 8% (65+); in 1993: 5% (15-19), 20% (20-24), 25% (25-29), 30% (30-34), 35% (35-39), 42% (40-44), 40% (45-49), 35% (50-54), 25% (55-59), 18% (60-64), 10% (65+).
Given the complexity of the image, the above description may not be entirely accurate.
Skyrocket your IELTS band score by 1-2 points in under a month with our premium plan!
Note: Both the topic and the answer were created by one of our users.
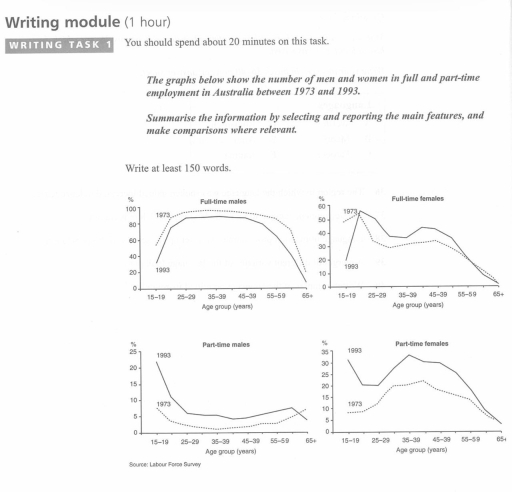
The line graph illustrates information about the number of men and women in full and part-time employment in Australia a period of 20 years between 1973 and 1993.
In overall employments who work in full time increased at this period of time, whereas workers in part-time males figure was incredibly deep following the line graph. Also female workers figure took a growth in some period of time.
Initially the full time males were incredibly big between 15-19 years and 55-59 years it increased over a 80% in 1993 and it was a less than 100% in 1973. However, part time workers were unbelievable little so between 25-29 years and 55-59 years old workers was less than 5% and it increased to over 5% in 1993.
Full time female employments were incredibly in peak. It figure was over 50% between 15-19 years old in 20 years and it was 1-2% in 65 years old people. Part time workers from female gender’s figure was in peak between 15-19 and 85-89 years olds in 1993, whereas in 1973 40-44 and 50-54 years old workers were in trend.
Word Count: 184