Our system will evaluate the answer based on this AI-generated description.
The image consists of four line graphs displaying employment data in Australia across three distinct age groups (15-19, 20-24, 25-29, 30-34, 35-39, 40-44, 45-49, 50-54, 55-59, 60-64, 65+) for 1973 and 1993. Full-time male employment in 1973: 60% (15-19), 90% (20-24), 95% (25-29 to 45-49), 92% (50-54), 88% (55-59), 70% (60-64), 20% (65+); in 1993: 50% (15-19), 81% (20-24), 90% (25-29 to 50-54), 80% (55-59), 60% (60-64), 20% (65+). Full-time female employment in 1973: 50% (15-19), 40% (20-24), 35% (25-29), 30% (30-34), 35% (35-39), 40% (40-44), 35% (45-49), 30% (50-54 to 55-59), 10% (60-64), 0% (65+); in 1993: 40% (15-19), 50% (20-24 to 30-34), 55% (35-39), 60% (40-44), 58% (45-49), 50% (50-54 to 55-59), 20% (60-64), 0% (65+). Part-time male employment in 1973: 5% (15-19), 2% (20-24), 1% (25-29 to 35-39), 2% (40-44), 3% (45-49), 4% (50-54), 8% (55-59), 15% (60-64), 20% (65+); in 1993: 8% (15-19), 5% (20-24), 3% (25-29), 4% (30-34), 3% (35-39), 4% (40-44 to 50-54), 5% (55-59), 15% (60-64), 25% (65+). Part-time female employment in 1973: 5% (15-19), 15% (20-24), 12% (25-29), 10% (30-34), 20% (35-39), 25% (40-44), 28% (45-49), 27% (50-54), 22% (55-59), 20% (60-64), 8% (65+); in 1993: 5% (15-19), 20% (20-24), 25% (25-29), 30% (30-34), 35% (35-39), 42% (40-44), 40% (45-49), 35% (50-54), 25% (55-59), 18% (60-64), 10% (65+).
Given the complexity of the image, the above description may not be entirely accurate.
Skyrocket your IELTS band score by 1-2 points in under a month with our premium plan!
Note: Both the topic and the answer were created by one of our users.
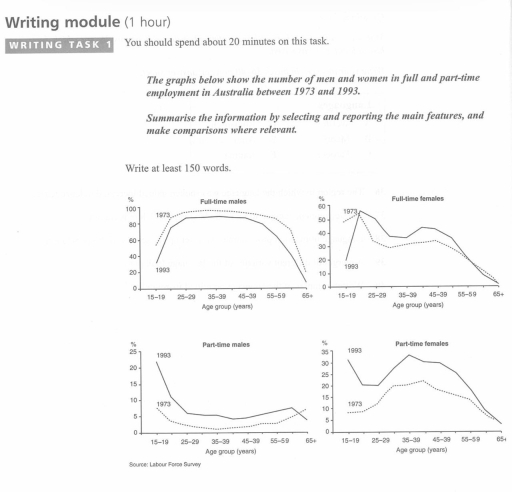
The four graphs illustrate the rate difference in full and part-time employment among men and women between 1973 and 1993. The data exhibits the proportion between the percentage of workers and their age group.
Males between 25 and 29 account for the largest number of full-time employees in both 1993 and 1973, reaching over 60% and 80% respectfully. The graph does not showcase significant decline until the ages above 55.
Meanwhile, a drastic difference could be noticed in the second male chart, which demonstrates low rate of part-time emploment. The most significant number, almost 25%, is amounted to men under 19 in 1993.
In comparison, women between 15 and 19, as well as 35 and 39, constituted almost 35% in 1993. The 1973 stats appear lower, however, still depict higher part-time employment rate then males.
Furthemore, the peak of female employees, working full-time, surges to over 50% in 1993, gradually decreasing overtime afterwards. The 1973 data exhibits similar path but with lower percentages.
Word Count: 163